Axes Setup
For some spatial plots (FOV, Fan, Grid), pyDARN allows users to choose between polar,
geographic, and geomagnetic axes using the projs keyword and Projs module.
Convection maps currently only use the polar projection, future development will include geomagnetic axes for map plots.
Remember to also set the correct coordinate system for your projection, see Ranges, Coords and Projs.
Projs.POLAR
| Option | Action |
|---|---|
| lowlat=(int) | Lower Latitude boundary for the polar plot (degree) (default: 30) |
| hemisphere=(pydarn.Hemisphere) | Hemisphere of the radar (default: Hemisphere.North) |
| coastline=(bool) | Uses Cartopy to add outlines to the coastlines |
| coastline_color=(str) | Uses Cartopy to colour outlines to the coastlines (default: black) |
| cartopy_scale=(str) | Uses Cartopy to set the resolution of the coastlines (options: '110m', '50m', '10m') |
| coastline_linewidth=(float) | Uses Cartopy to set line width of the coastlines |
| nightshade=(int) | Uses the value given to calculate and show where on the plot the Earth is in shadow |
This choice will return an ax object and a value of None for the Cartopy ccrs (coordinate reference system).
The polar projection allows for a lowlat keyword to plot the lowest latitude, but the center of the plot is fixed to the geomagnetic pole, if you would like to zoom in on a specific area, use one of the other two projections below.
import pydarn
import datetime as dt
import matplotlib.pyplot as plt

pydarn.Fan.plot_fov(stid=pydarn.RadarID.RKN, date=dt.datetime(2024,7,23,0,0),
                    radar_label=True, fov_color='green',
                    line_color='green', alpha=0.8, lowlat=60, coastline=True,
                    projs=pydarn.Projs.POLAR, coords=pydarn.Coords.AACGM_MLT)
plt.title('Rankin Inlet FOV in the POLAR projection')
plt.show()

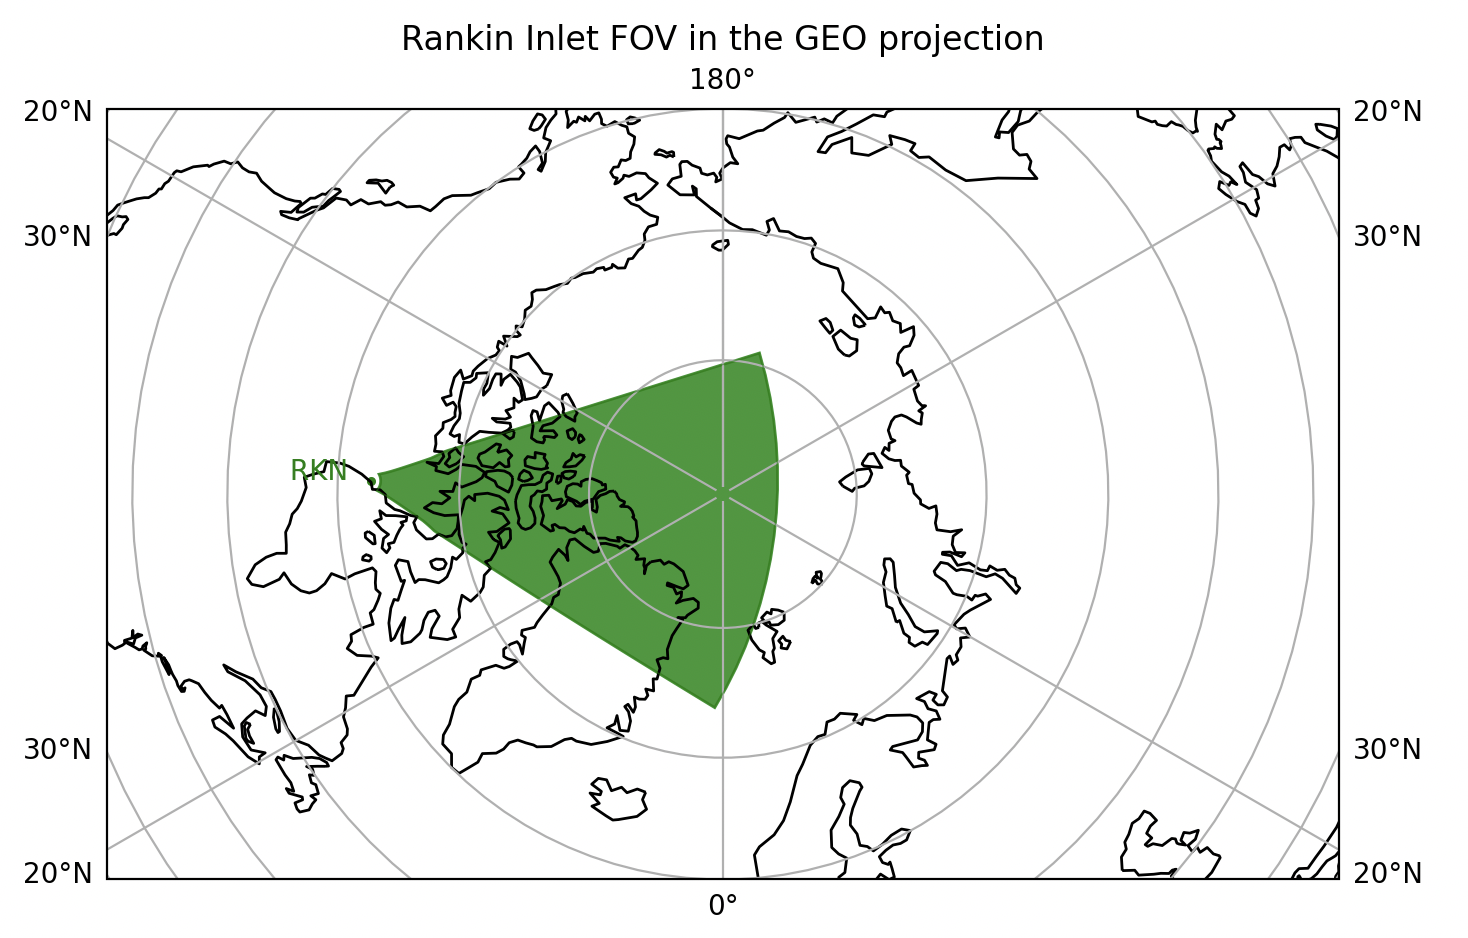
Projs.GEO
| Option | Action |
|---|---|
| lowlat=(int) | Lower Latitude boundary for the plot (degrees) (default: 30) |
| hemisphere=(pydarn.Hemisphere) | Hemisphere of the radar (default: Hemisphere.North) |
| coastline=(bool) | Uses Cartopy to add an outline of the coastlines |
| coastline_color=(str) | Uses Cartopy to colour the outline of the coastlines (default: black |
| cartopy_scale=(str) | Uses Cartopy to set the resolution of the coastlines (options: '110m', '50m', '10m') |
| coastline_linewidth=(float) | Uses Cartopy to set line width of the coastline outlines |
| grid_lines=(bool) | Uses Cartopy to plot grid lines |
| nightshade=(int) | Uses the value given to calculate and show where on the plot the Earth is in shadow |
| plot_center=[float,float] | Longitude and latitude of the desired center of the plot (e.g. [-90, 60]) |
| plot_extent=[float,float] | Plotting extent in terms of percentage of the earth [X-axis,Y-axis] (e.g. [80,50]) |
This choice will return an ax object and a Cartopy ccrs object (coordinate reference system).
import pydarn
import datetime as dt
import matplotlib.pyplot as plt

pydarn.Fan.plot_fov(stid=pydarn.RadarID.RKN, date=dt.datetime(2024,7,23,0,0),
                    radar_label=True, fov_color='green',
                    line_color='green', alpha=0.8, plot_extent=[80,50],
                    coastline=True, projs=pydarn.Projs.GEO,
                    coords=pydarn.Coords.GEOGRAPHIC)
plt.title('Rankin Inlet FOV in the GEO projection')
plt.show()
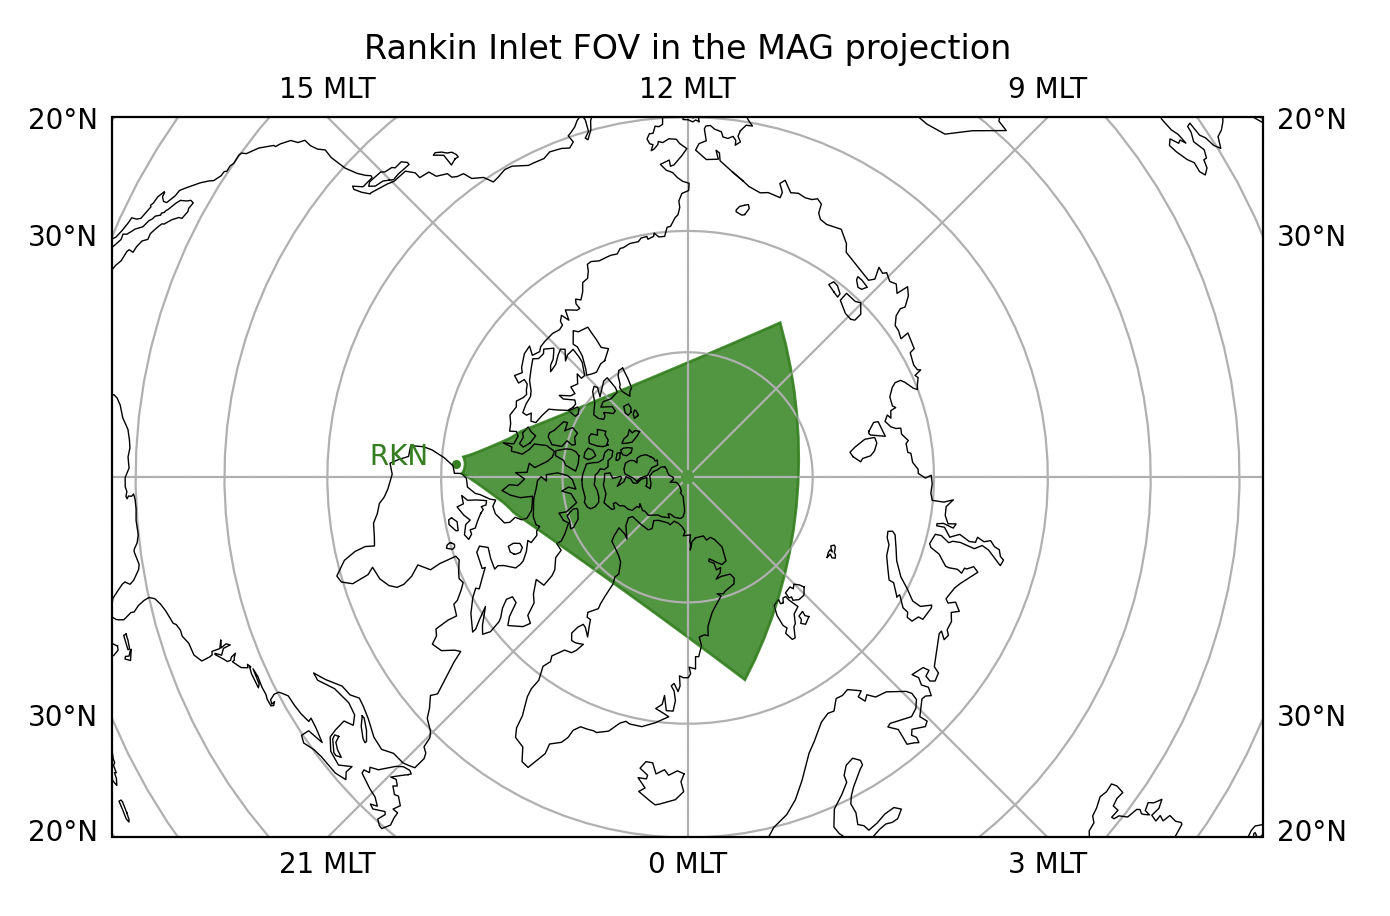
Projs.MAG
| Option | Action |
|---|---|
| lowlat=(int) | Lower Latitude boundary for the plot (degree) (default: 30) |
| hemisphere=(pydarn.Hemisphere) | Hemisphere of the radar (default: Hemisphere.North) |
| coastline=(bool) | Uses Cartopy to add outlines of the coastlines |
| coastline_color=(str) | Uses Cartopy to colour outlines of the coastlines (default: black) |
| cartopy_scale=(str) | Uses Cartopy to set the resolution of the coastlines (options: '110m', '50m', '10m') |
| coastline_linewidth=(float) | Uses Cartopy to set line width of the coastlines |
| grid_lines=(bool) | Uses Cartopy to plot grid lines |
| nightshade=(int) | Uses the value given to calculate and show where on the plot the Earth is in shadow |
| plot_center=[float,float] | MLT(MAG)/Longitude(GEO) and latitude of the desired center of the plot (e.g. [6, 60]) |
| plot_extent=[float,float] | Plotting extent in terms of percentage of the earth (e.g. [80,50]) |
This choice will return an ax object and a Cartopy ccrs object (coordinate reference system).
This option uses Cartopy, but amends the coastlines and plotting features to plot in AACGMv2 magnetic latitude and MLT.
Note
AACGMv2 is not a 1-1 translation from geographic coordinates, you should expect some distortion.
import pydarn
import datetime as dt
import matplotlib.pyplot as plt

pydarn.Fan.plot_fov(stid=pydarn.RadarID.RKN, date=dt.datetime(2024,7,23,0,0),
                    radar_label=True, fov_color='green',
                    line_color='green', alpha=0.8, plot_extent=[80,50],
                    coastline=True, projs=pydarn.Projs.MAG,
                    coords=pydarn.Coords.AACGM_MLT)
plt.title('Rankin Inlet FOV in the MAG projection')
plt.show()
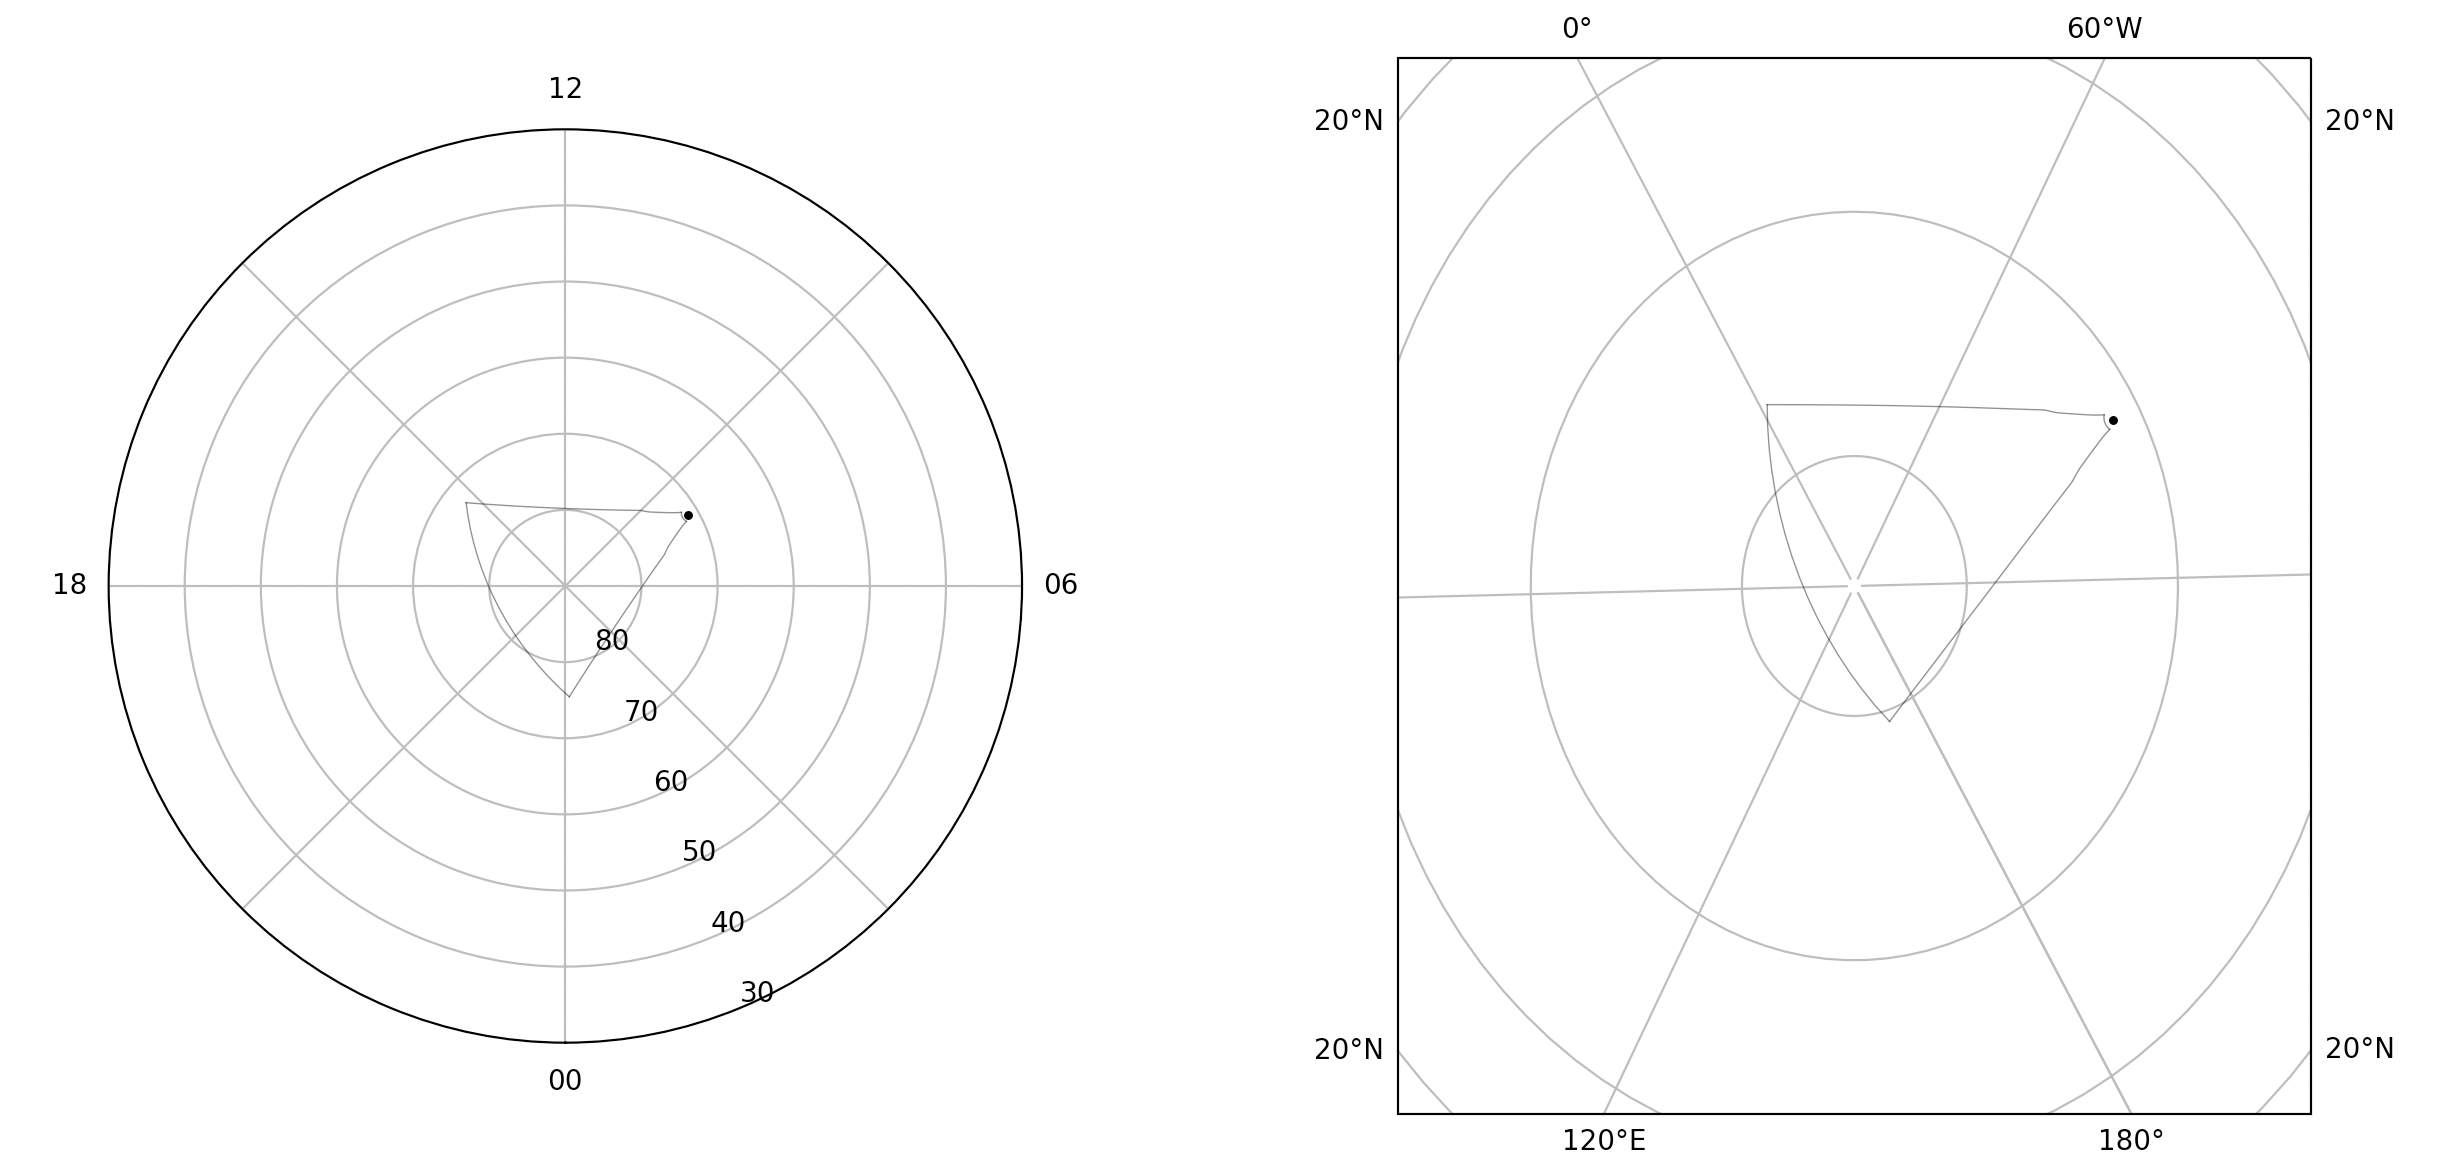
Custom Axes
pyDARN does not currently support use of custom axes to read in and plot on. This means that use of subplots is not supported. There are ways to get around this, if a custom axis that has the same setup as any of the axes above is read into the subplot. For example, a polar and a geographic plots can be positioned using subplots as follows:
import pydarn
import datetime as dt
import numpy as np
import matplotlib.pyplot as plt
import cartopy.crs as ccrs

# Polar plot
date=dt.datetime(2022, 1, 8, 14, 5)
fig = plt.figure(figsize=(6, 6))
ax1 = fig.add_subplot(121, projection='polar')
ax1.set_ylim(90, 30)
ax1.set_yticks(np.arange(30, 90, 10))
ax1.set_xticks([0, np.radians(45), np.radians(90), np.radians(135),
                       np.radians(180), np.radians(225), np.radians(270),
                       np.radians(315)])
ax1.set_xticklabels(['00', '', '06', '', '12', '', '18', ''])
ax1.set_theta_zero_location("S")
pydarn.Fan.plot_fov(stid=pydarn.RadarID.RKN, date=date, ax=ax1)

# Geo plot
deg_from_midnight = (date.hour + date.minute / 60) / 24 * 360
pole_lat = 90
noon = -deg_from_midnight
ylocations = -5
proj = ccrs.Orthographic(noon, pole_lat)
ax2 = fig.add_subplot(122, projection=proj, aspect='auto')
ax2.gridlines(draw_labels=True)
extent = min(45e5,(abs(proj.transform_point(noon, 30, ccrs.PlateCarree())[1])))
ax2.set_extent(extents=(-extent, extent, -extent, extent), crs=proj)
pydarn.Fan.plot_fov(stid=pydarn.RadarID.RKN, date=date, ax=ax2, ccrs=ccrs, coords=pydarn.Coords.GEOGRAPHIC, projs=pydarn.Projs.GEO)
plt.tight_layout()
plt.show()