Field Of View Plots
Field Of View (FOV) plots show the radars scanning region for a given radar station id.
import pydarn
from datetime import datetime
import matplotlib.pyplot as plt

pydarn.Fan.plot_fov(pydarn.RadarID.CLY, datetime(2015, 3, 8, 15, 0), radar_label=True)
plt.show()
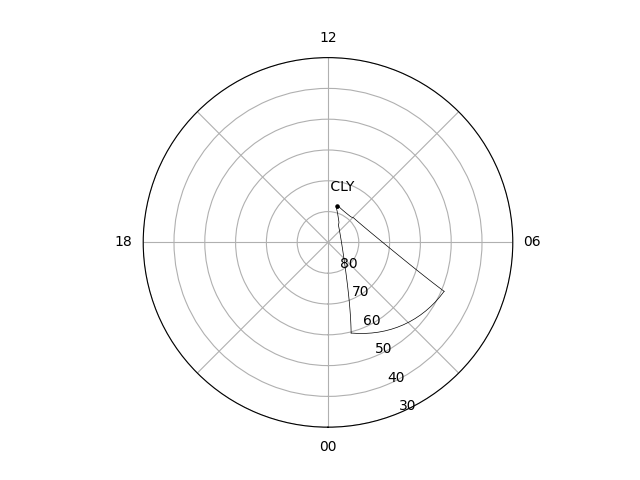
A datetime object of the date is required to convert to Coords.AACGM_MLT (default) or Coords.AACGM.
Additional options
Here is a list of all the current options than can be used with plot_fov
| Option | Action |
|---|---|
| stid=pydarn.RadarID | Station id of the radar. |
| date=(datetime) | datetime object to determine the position the radar fov AACGM or AACGM MLT coordinates |
| ranges=(list) | Two element list giving the lower and upper ranges to plot, grabs ranges from hardware file (default [] |
| ax=(Axes Object) | Matplotlib axes object than can be used for cartopy additions |
| ccrs=(object) | Cartopy axes object for plotting using Cartopy |
| rsep=(int) | Range Seperation (km) (default: 45 km) |
| frang=(int) | Frequency Range (km) (default: 180 km) |
| projs=(Projs) | Projection for the plot to be plotted on Polar and Geographic (GEO) (default: Projs.POLAR) |
| coords=(Coords) | Coorindates Geographic, AACGM, or AACGM MLT (default: Coords.AACGM_MLT) |
| grid=(bool) | Boolean to apply the grid lay of the FOV (default: False ) |
| colorbar=(bool) | Set true to plot a colorbar (default: True) |
| colorbar_label=(string) | Label for the colour bar (requires colorbar to be true) |
| boundary=(bool) | Set false to not show the outline of the radar FOV (default: True) |
| grid=(bool) | Set true to show the outline of the range gates inside the FOV (default: False) |
| fov_color=(string) | Sets the fill in color for the fov plot (default: transparency) |
| line_color=(string) | Sets the boundary line and radar location dot color (default: black) |
| alpha=(int) | Sets the transparency of the fill color (default: 0.5) |
| line_alpha=(int) | Sets the transparency of the boundary and grid lines if shown (default: 0.5) |
| radar_location=(bool) | Places a dot in the plot representing the radar location (default: True) |
| radar_label=(bool) | Places the radar 3-letter abbreviation next to the radar location |
| coastline=(bool) | Plots outlines of coastlines below FOV (Uses Cartopy) |
| beam=(int) | Only plots outline/fill of specified beam (default: None) |
| plot_tight=(bool)* | Centers the radars FOV in the plot and calculates extents based on FOV (default: False) |
| kwargs ** | Axis Polar settings. See polar axis |
Note
- plot_tight option only works with MAG and GEO projections, plot_tight will overwrite plot_center and plot_extent options from axis setup
Examples
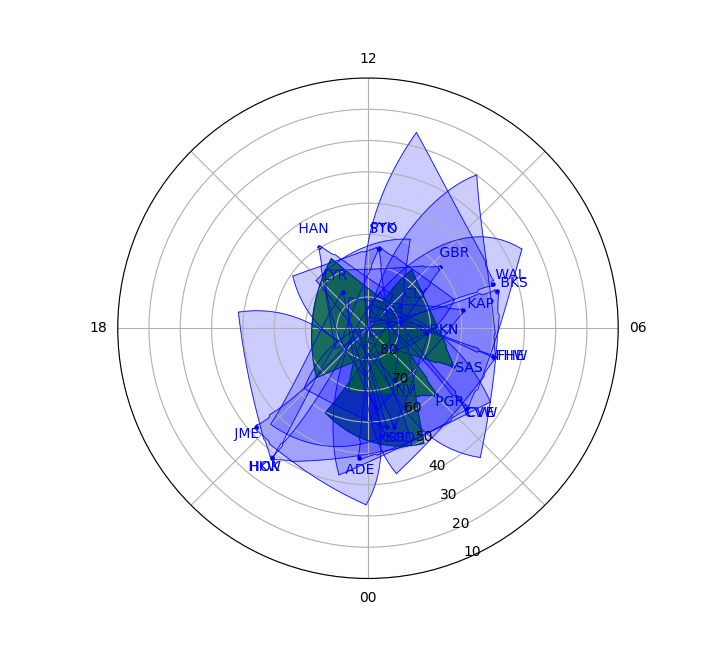
To plot based on hemisphere or selection of radars, here is an example plotting North hemisphere radars with selected SuperDARN Canada radars colored as green, note that the axes object (ax) needs to be updated inside to loop to plot multiple FOV:
import pydarn
from datetime import datetime
import matplotlib.pyplot as plt

fov_rtn = {}
fov_rtn['ax'] = None
for stid in pydarn.RadarID:
    if pydarn.SuperDARNRadars.radars[stid].hemisphere == pydarn.Hemisphere.North:
        if stid != pydarn.RadarID.SCH:
            if stid in [
                pydarn.RadarID.SAS,
                pydarn.RadarID.PGR,
                pydarn.RadarID.CLY,
                pydarn.RadarID.RKN,
                pydarn.RadarID.INV
            ]:
                fov_rtn = pydarn.Fan.plot_fov(stid, datetime(2021, 2, 5, 12, 5),
                                              radar_label=True, fov_color='green',
                                              line_color='green', alpha=0.8, ax=fov_rtn['ax'])
            else:
                fov_rtn = pydarn.Fan.plot_fov(stid, datetime(2021, 2, 5, 12, 5),
                                              radar_label=True, fov_color='blue',
                                              line_color='blue', alpha=0.2, lowlat=10,
                                              ax=fov_rtn['ax'])

plt.show()
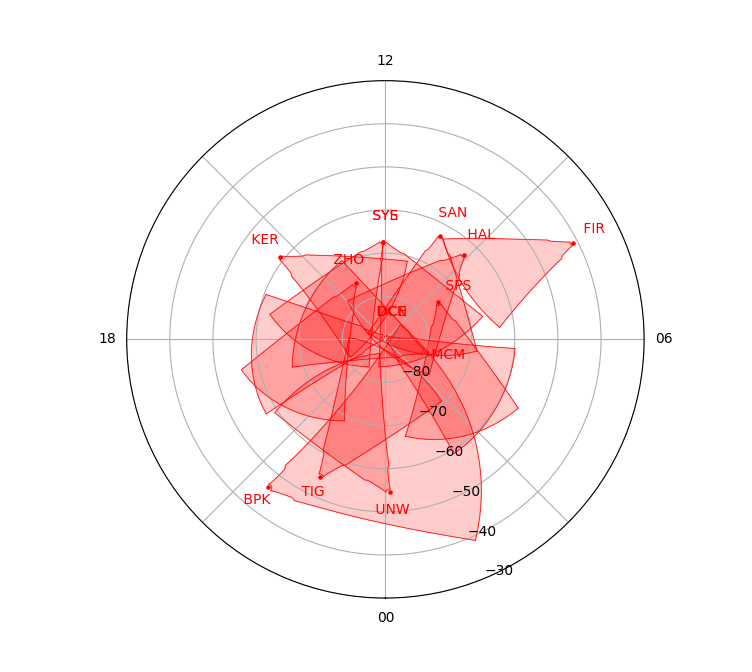
This example will plot all radars in the southern hemisphere FOV in red:
import pydarn
from datetime import datetime
import matplotlib.pyplot as plt

fov_rtn = {}
fov_rtn['ax'] = None
for stid in pydarn.RadarID:
    if pydarn.SuperDARNRadars.radars[stid].hemisphere == pydarn.Hemisphere.South:
        if stid != pydarn.RadarID.SCH:
            fov_rtn = pydarn.Fan.plot_fov(stid, datetime(2021, 2, 5, 12, 5),
                                          radar_label=True, fov_color='red',
                                          line_color='red', alpha=0.2, ax=fov_rtn['ax'])
plt.show()
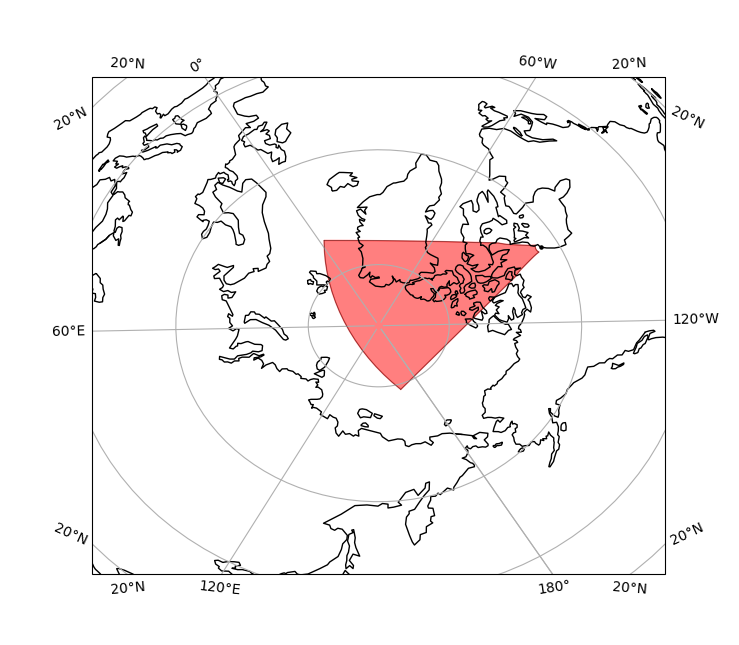
This example shows plotting in geographic coordinates with the coastline outlines.
import pydarn
from datetime import datetime
import matplotlib.pyplot as plt

pydarn.Fan.plot_fov(stid=pydarn.RadarID.RKN, date=datetime(2022, 1, 8, 14, 5),
                    fov_color='red', coords=pydarn.Coords.GEOGRAPHIC,
                    projs=pydarn.Projs.GEO, coastline=True)
plt.show()
Note
If plotting multiple FOV on one plot for geographic coordinates, it is required that the ax and ccrs of the initial plot is read into the subsequent plots. Each subsequent plot also needs to be told that it is supposed to be in geographic coordinates and/or geographic projection using the coords and projs keywords.
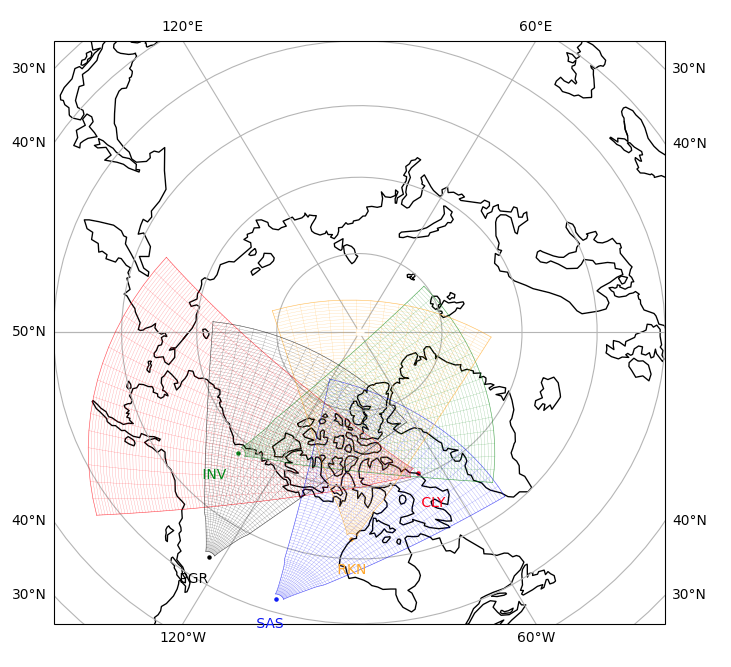
This is an example of multiple FOV in geographic coordinates using the correct set of keywords.
import pydarn
from datetime import datetime
import matplotlib.pyplot as plt

fov_rtn = pydarn.Fan.plot_fov(pydarn.RadarID.CLY, datetime(2021, 6, 21, 6, 0),
                              lowlat= 50, boundary=True, radar_label=True,
                              line_color='red', grid = True,
                              coords=pydarn.Coords.GEOGRAPHIC,
                              projs=pydarn.Projs.GEO, coastline=True)
pydarn.Fan.plot_fov(pydarn.RadarID.SAS, datetime(2021, 2, 5, 12, 5), radar_label=True,
                    ax=fov_rtn['ax'], ccrs=fov_rtn['ccrs'], boundary=True,
                    line_color='blue', grid = True,
                    coords=pydarn.Coords.GEOGRAPHIC,
                    projs=pydarn.Projs.GEO)
pydarn.Fan.plot_fov(pydarn.RadarID.INV, datetime(2021, 2, 5, 12, 5), radar_label=True,
                    ax=fov_rtn['ax'], ccrs=fov_rtn['ccrs'],
                    boundary=True, line_color='green',
                    grid = True, coords=pydarn.Coords.GEOGRAPHIC,
                    projs=pydarn.Projs.GEO)
pydarn.Fan.plot_fov(pydarn.RadarID.RKN, datetime(2021, 2, 5, 12, 5), radar_label=True,
                    ax=fov_rtn['ax'], ccrs=fov_rtn['ccrs'],
                    boundary=True, line_color='orange',
                    grid = True, coords=pydarn.Coords.GEOGRAPHIC,
                    projs=pydarn.Projs.GEO)
pydarn.Fan.plot_fov(pydarn.RadarID.PGR, datetime(2021, 2, 5, 12, 5), radar_label=True,
                    ax=fov_rtn['ax'], ccrs=fov_rtn['ccrs'],
                    boundary=True, grid = True,
                    coords=pydarn.Coords.GEOGRAPHIC, projs=pydarn.Projs.GEO)
plt.show()
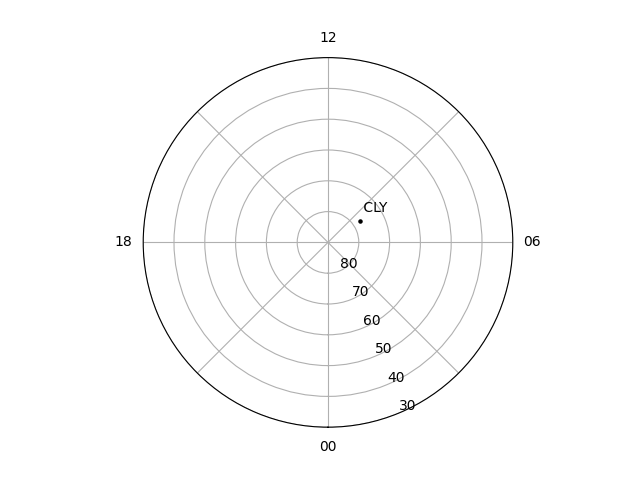
To obtain only dots and labels:
import pydarn
from datetime import datetime
import matplotlib.pyplot as plt

pydarn.Fan.plot_fov(pydarn.RadarID.CLY, datetime(2021, 2, 5, 12, 5), boundary=False,
                    radar_label=True)
plt.show()
Note
The radar label positions have been manually set in geographic and geomagnetic coordinates so that no labels overlap. Users can plot their own labels using plt.text(*lon psn in radians/degrees*, *lat psn in degrees*, *text string*) if the current position used is not suitable. You may need to include a Cartopy transform if using the GEO or MAG projections from Cartopy.