Statistical Power Plots
This function will calculate and plot a statistic of the lag-0 power of each record as a function of time.
This function applies the statistical function (ex. numpy.mean) to the pwr0 vector (lag-0 power for each range) for each record before plotting the results from all records chronologically.
This code can be used to study background interference in rawacf data when the radar has been operating in a receive-only mode such as "politescan" (cpid -3380), or during periods without any obvious coherent scatter returns from any range.
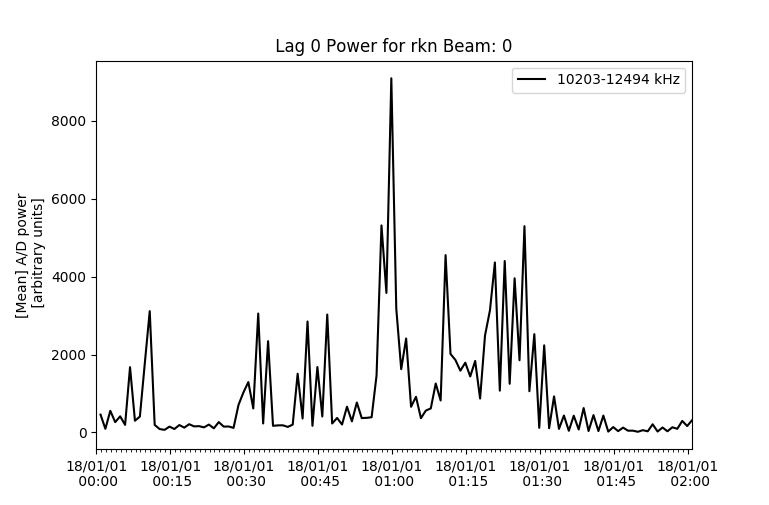
Basic code to plot lag 0, will plot the mean of pwr0 for all frequencies at beam 0, from a RAWACF file would look like:
import matplotlib.pyplot as plt
import pydarn

file = "20180101.0000.01.rkn.rawacf"
rawacf_data, _ = pydarn.read_rawacf(file)

pydarn.Power.plot_pwr0_statistic(rawacf_data)
plt.show()
You also have access to numerous plotting options:
| Parameter | Action |
|---|---|
| beam_num=0 | beam number to plot |
| min_frequency | minimum Frequency (inclusive) to plot |
| max_frequency | maximum Frequency (inclusive) to plot |
| split_frequency | specific frequency to look for or split between |
| statistical_method=np.mean | the statistical calculation to apply to the pwr0 array |
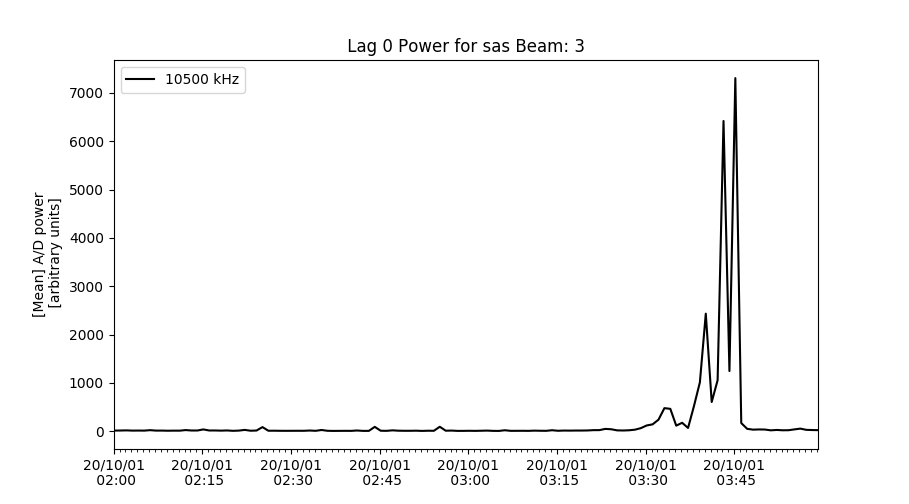
If you want display only one frequency set min_frequency = max_frequency:
import pydarn
import matplotlib.pyplot as plt

rawacf_file = '20201001.0200.00.sas.0.rawacf.hdf5'
rawacf_data, _ = pydarn.read_borealis(rawacf_file)
pydarn.Power.plot_pwr0_statistic(rawacf_data, beam_num=3, min_frequency=10500, max_frequency=10500)
plt.show()
Warning
If the radar is running non-normal scan mode then the this may produce a blank plot or raise an error of No Data Found. Also, ROS superDARN radars will vary slightly in a frequency thus causing issues for picking a specific frequency.
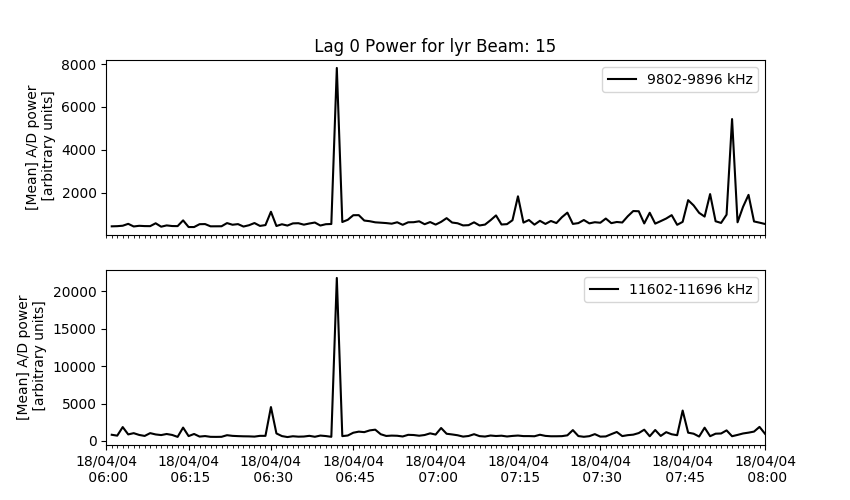
To compare data above and below a specific frequency, you can compare by using the split_frequency option:
import pydarn
import matplotlib.pyplot as plt

rawacf_file = 'data/20180404.0601.00.lyr.rawacf'
rawacf_data, _ = pydarn.read_rawacf(rawacf_file)
pydarn.Power.plot_pwr0_statistic(rawacf_data, beam_num=15, split_frequency=11000, max_frequency=12000)
plt.show()
Note
Depending on the mode that is being run, type of radar system, and the frequency range you may get this error plot_exceptions.NoDataFoundError. Make sure you know the frequency range for your data as there might be data at a different frequency range, the parameters just need to be tweaked a bit.