Grid plots
Grid plots are a way to visualise data from a GRID file of a SuperDARN radar(s). Please read RST documentation on how to process GRID files and GRD files from FITACF files.
Basic usage
Read in the desired GRID file.:
import matplotlib.pyplot as plt
import pydarn

file = "path/to/grid/file"
grid_data, _ = pydarn.read_grid(file)
With the grid data loaded as a list of dictionaries (grid_data variable in above example), you may now call the plot_grid method. Make sure you tell the method what time, in DateTime format, or record number (numbered from first recorded in file, counting from 0):
import datetime as dt

stime = dt.datetime(year, month, day, hour, minute)
grid_rtn = pydarn.Grid.plot_grid(grid_data, start_time=stime)
plt.show()
In this example, the record at stime was plotted with the defaulted parameter, line-of-sight velocity, being gridded:
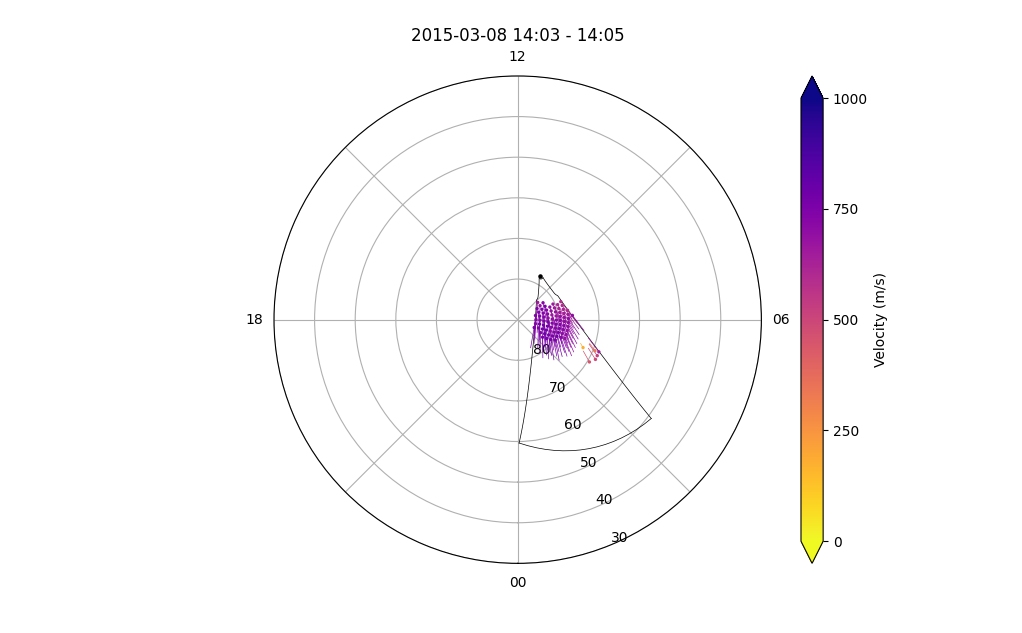
You might have noticed that the variable gridplot in the examples above actually holds some information. This dictionary contains the AACGM latitude and longitude of the gridded vectors plotted, as well as the data:
grid_rtn = pydarn.Grid.plot_grid(grid_data, start_time=stime)
print(grid_rtn.keys())
Additional Parameters
In addition to the gridded line-of-sight velocity, you can choose one of two other data products to plot by setting parameter=String name:
| Data product | String name |
|---|---|
| Line of sight velocity (m/s) [Default] | vec |
| Spectral width (m/s) | wdt |
| Power (dB) | pwr |
Additional Options
Here is a list of all the current options than can be used with plot_grid
| Option | Action |
|---|---|
| record=(int) | Record number to plot |
| start_time=(datetime.datetime) | The start time of the record to plot |
| time_delta=(int) | How close to the start time to be to the start time of the record |
| lowlat=(int) | Control the lower latitude boundary of the plot (default 30/-30 AACGM lat) |
| boundary=(bool) | Boolean to show the Field-of-View of the radar(s) |
| cmap=matplotlib.cm | A matplotlib color map object. Will override the pyDARN defaults for chosen parameter |
| zmin=(int) | Minimum data value for colouring |
| zmax=(int) | Maximum data value for colouring |
| colorbar=(bool) | Set true to plot a colorbar (default: True) |
| colorbar_label=(string) | Label for the colour bar (requires colorbar to be true) |
| title=(str) | To add a title to the plot |
| radar_label=(str) | To include a dot at radar location and label of 3 letter code |
| fov_color=(str) | Fill color of fov |
| line_color=(str) | Fill color of fov lines |
| coastline=(bool) | Plots outlines of coastlines below grid data |
| coords=(Coords) | Coordinates for the data to be plotted in |
| projs=(Projs) | Projections to plot the data on top of |
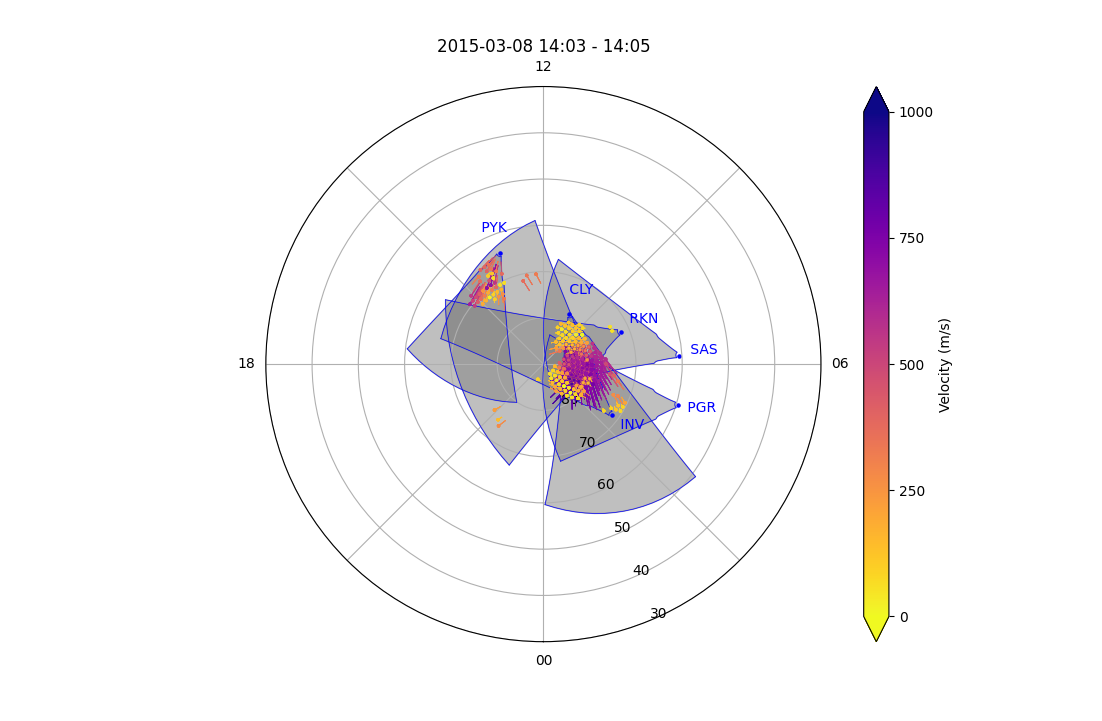
As an example, the following code plots multiple radar Grid plot:
import matplotlib.pyplot as plt
import datetime as dt
import pydarn

#Read in GRID file
stime = dt.datetime(2015, 3, 8, 14, 2)
grid_file = "20150308.n.grd"
grid_data, _ = pydarn.read_grid(grid_file)

pydarn.Grid.plot_grid(grid_data, start_time=stime,
                      colorbar_label='Velocity (m/s)',
                      radar_label=True, line_color='blue',
                      fov_color='grey')

plt.show()