Coordinate-Time Parameter Plots
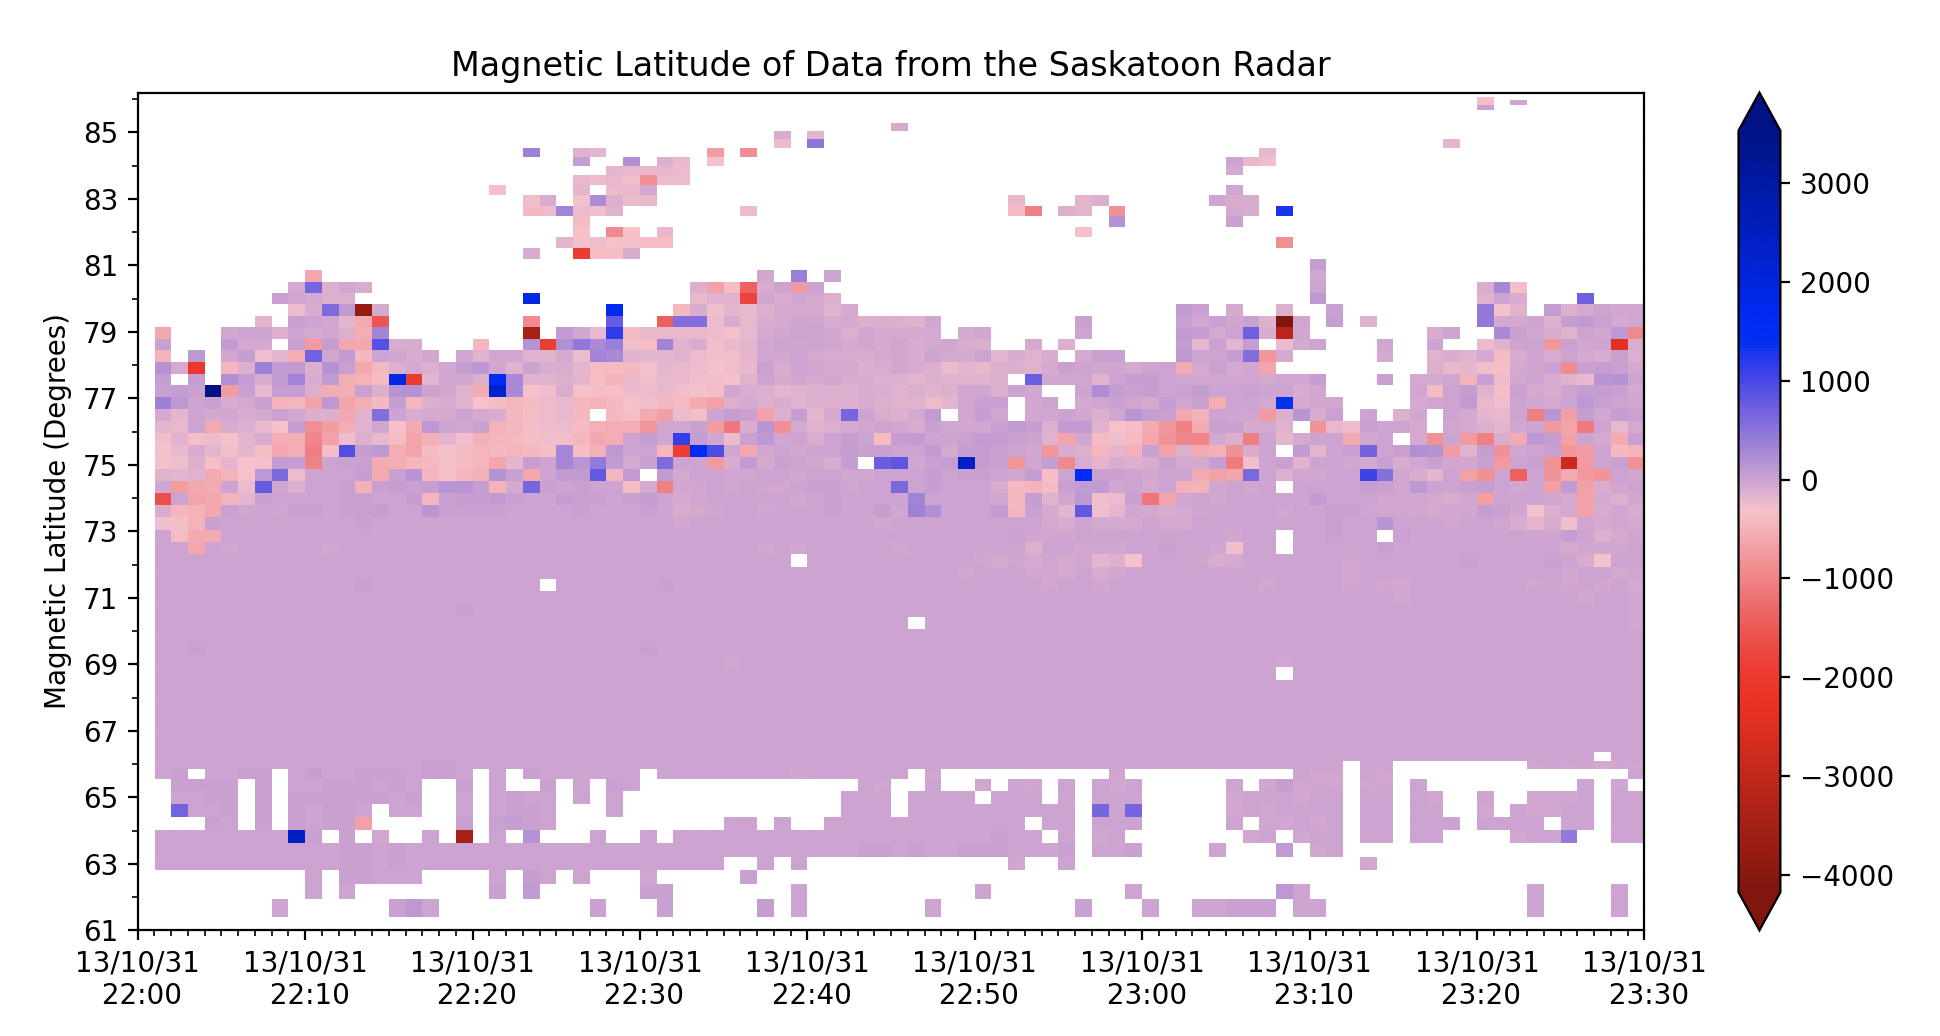
Similar to range-time plots, the coordinate-time plots allow the user to plot data with geographic or magnetic longitude or latitude. Coordinate-time plots have the same additional options as the range-time plots. The coord-time plot by default will show magnetic latitude on the y-axis. Where a range estimation can be used to convert the range gate to a distance from the radar which is in turn converted into a location in latitude or longitude.
Your plot can be made with a combination of the range_estimate, coords and latlon keywords.
For example, if range_estimate=RangeEstimate.SLANT_RANGE, coords=Coords.AACGM and latlon='lat', this method will produce a plot with magnetic latitude on the y-axis calculated from the slant range value.
import pydarn
import matplotlib.pyplot as plt

fitacf_data, _ = pydarn.read_fitacf('file/name.fitacf')
pydarn.RTP.plot_coord_time(fitacf_data, beam_num=0,
                        range_estimation=pydarn.RangeEstimation.SLANT_RANGE,
                        latlon='lat', coords=pydarn.Coords.AACGM)
plt.title('Magnetic Latitude of Data from the Saskatoon Radar')
plt.ylabel('Magnetic Latitude (Degrees)')
plt.show()
Warning
This plotting method does not evaluate if the data is appropriate to plot in the given circumstances. Some radars point north and some point longitudinally, therefore data shown in a plot may not be useful given the orientation.
Some radars also have a field of view that may increase but then decrease in latitude, we have tried to solve this using the keyword plot_equatorward.
Plot Equatorward?
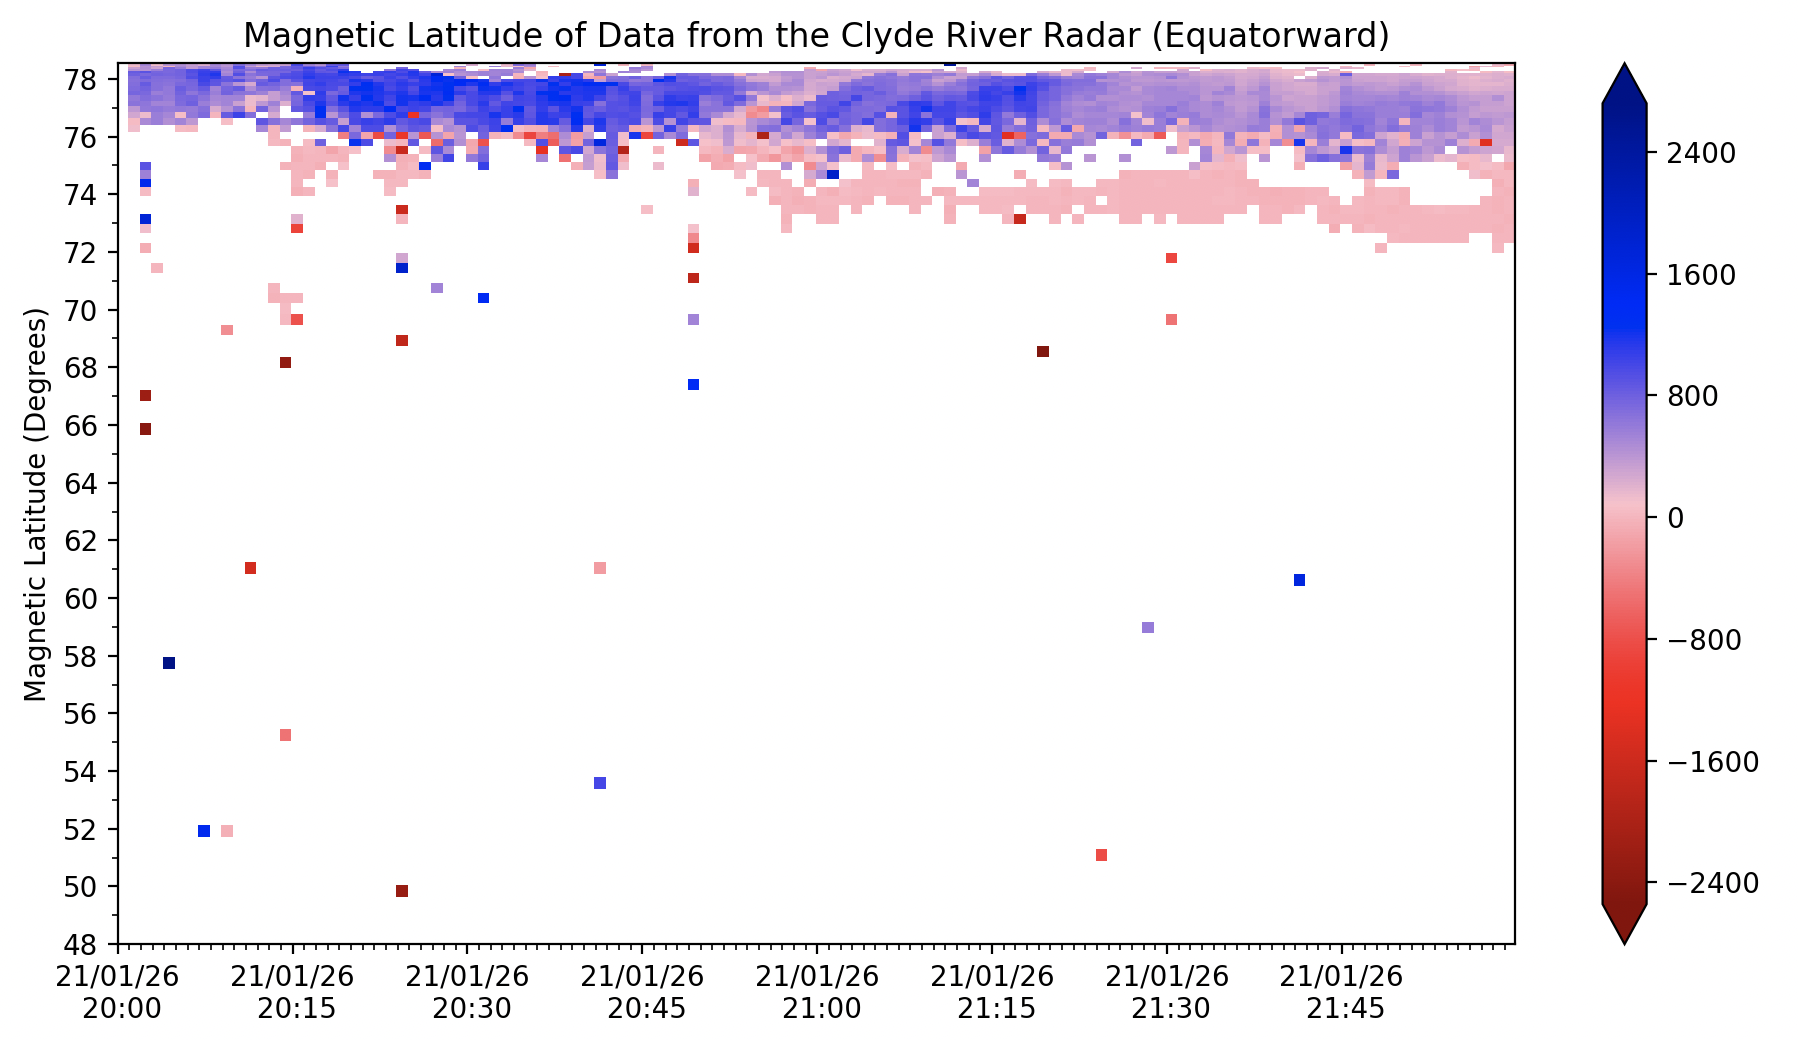
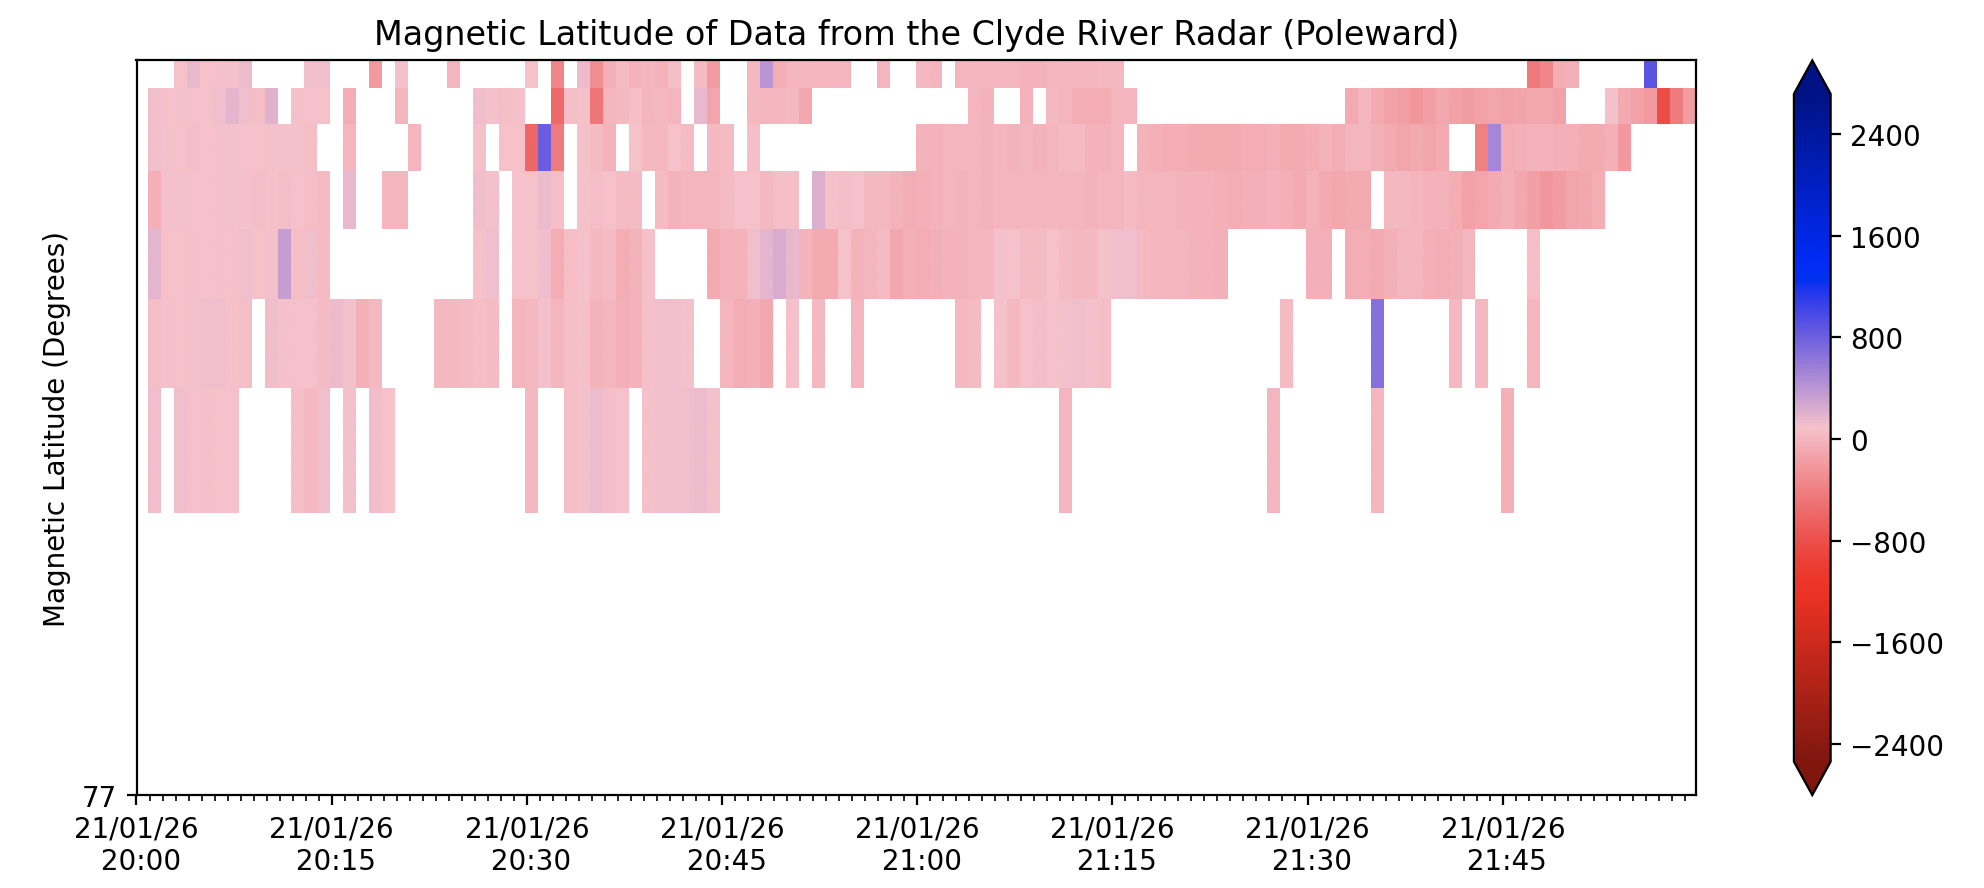
As mentioned, some radar FOV go up then down in latitude over the length of a beam. So that we do not overplot and potentially misrepresent data, the user can choose to plot the 'up' section of data (poleward), or the 'down' section of data (equatorward).
For example, using Clyde River data, you can use the plot_equatorward keyword to avoid overplotting and can see the data more clearly. The default for this keyword is False, however, the console will print information for you regarding the point at which the data changes direction and how to plot the remaining data.
import pydarn
import matplotlib.pyplot as plt

a = pydarn.RTP.plot_coord_time(fitacf_data, beam_num=0,
                            range_estimation=pydarn.RangeEstimation.SLANT_RANGE,
                            latlon='lat', coords=pydarn.Coords.AACGM,
                            plot_equatorward=True)
plt.title('Magnetic Latitude of Data from the Clyde River Radar (Equatorward)')
plt.ylabel('Magnetic Latitude (Degrees)')
plt.show()
import pydarn
import matplotlib.pyplot as plt

a = pydarn.RTP.plot_coord_time(fitacf_data, beam_num=0,
                            range_estimation=pydarn.RangeEstimation.SLANT_RANGE,
                            latlon='lat', coords=pydarn.Coords.AACGM,
                            plot_equatorward=False)
plt.title('Magnetic Latitude of Data from the Clyde River Radar (Poleward)')
plt.ylabel('Magnetic Latitude (Degrees)')
plt.show()
Note
These same key words can also be used in the summary plot method to plot coordinate-time data in summary format.
Note
In some circumstances the radar is likely to not be located at the 'bottom' of the plot like in the range-time plots, but can be located at a higher lat or lon. Please be aware of the geometry of the system when interpreting data in this plot style.