Summary plots
Summary plots in SuperDARN are a collection of set parameter plots from a FITACF file, and show a easily accessible overview of data in a FITACF file. The parameters shown in the plots are:
- Time-series plots:
- Sky Noise (
noise.sky) - Transmission Frequency and Number of averages (
tfreqandnav) - Control Program ID (
cp)
- Sky Noise (
- Range(or Coord)-time plots:
- Signal to Noise (
p_l) - Velocity (
v) - Spectral Width (
w_l) - Elevation (
elv)
- Signal to Noise (
Note
Elevation (elv) will be plotted as default if the FITACF file contains elevation data.
Default Summary
With pyDARN and matplotlib imported, read in a FITACF with pydarn.read_fitacf(), then call plot_summary with a chosen beam number. Here, we've loaded in some data from Clyde River and chosen beam 2:
import matplotlib.pyplot as plt
import pydarn

fitacf_file = "20190831.C0.cly.fitacf"
fitacf_data, _ = pydarn.read_fitacf(fitacf_file)

pydarn.RTP.plot_summary(fitacf_data, beam_num=2,
                        range_estimation=pydarn.RangeEstimation.RANGE_GATE)
plt.show()
which gives:
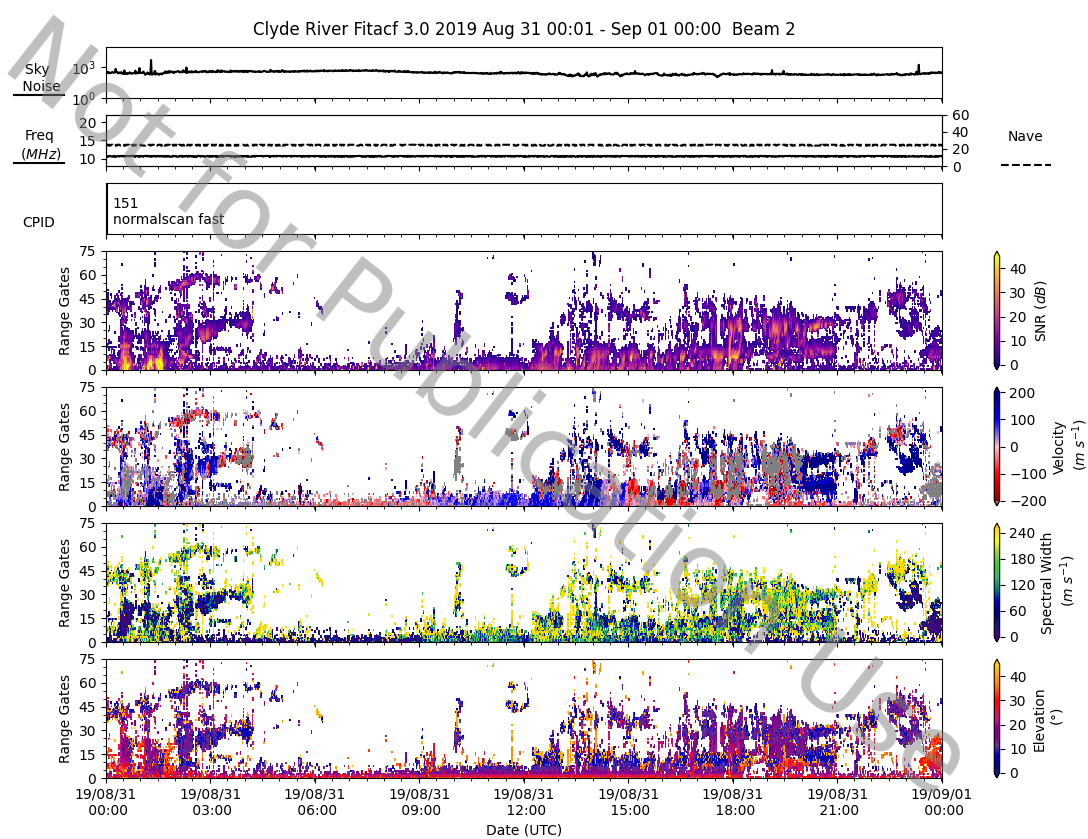
Note that ground scatter is displayed as default in the velocity panel. To disable it, you can use the option groundscatter=false.
In addition, we use range_estimation=pydarn.RangeEstimation.RANGE_GATE to set the y-axis to plot in range gates.
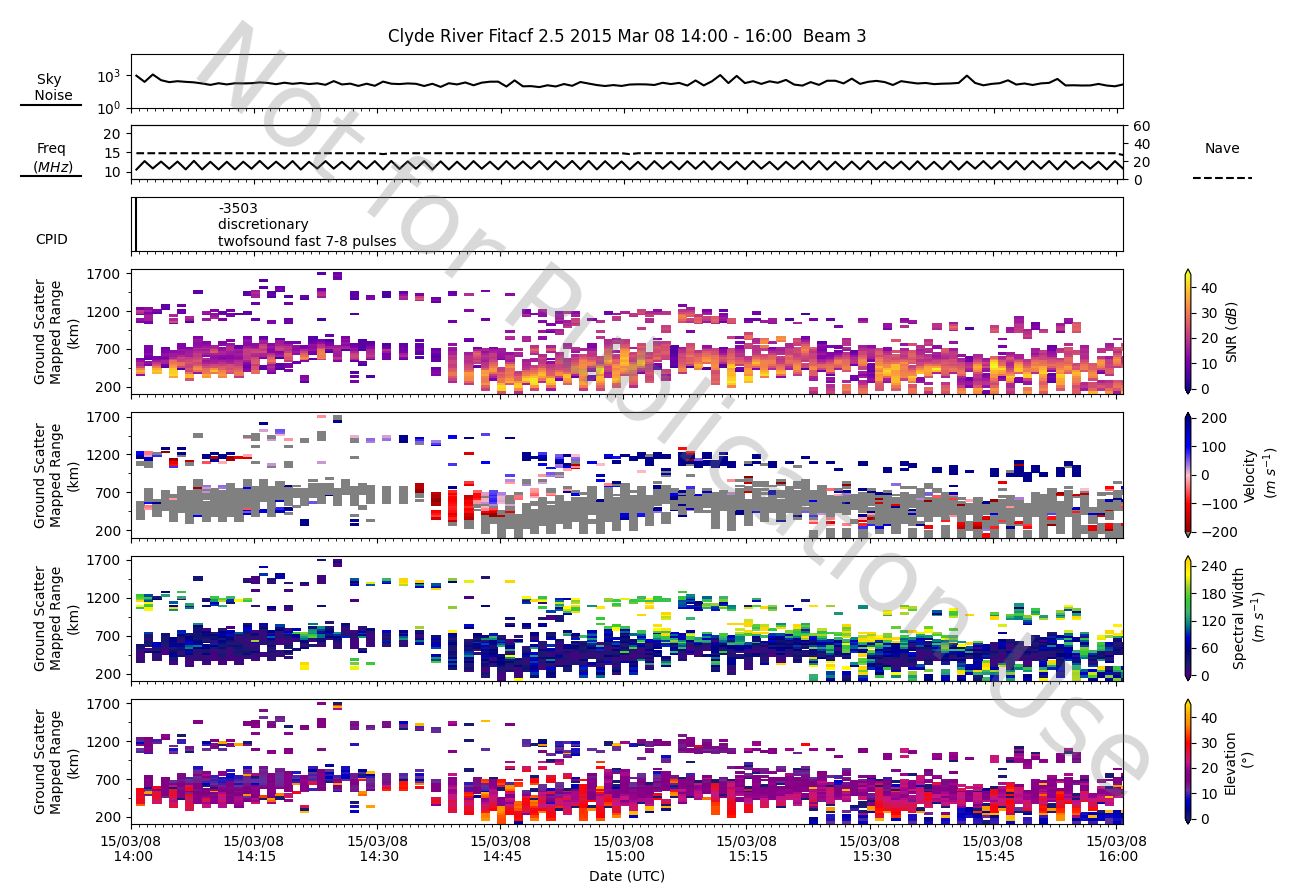
Ground-Scatter Mapped Range is another type of axis you can use with range-time plots:
pydarn.RTP.plot_summary(fitacf_data, beam_num=3,
                        range_estimation=pydarn.RangeEstimation.GSMR)
Additional options
In the example above, we can see the velocities are a little too high for the default colour scale. To change that, we need to create a python dictionary that redefines the boundaries:
boundaries={'v': [-500,500]}

pydarn.RTP.plot_summary(fitacf_data,beam_num=2,boundary=boundaries)
plt.show()
which gives:
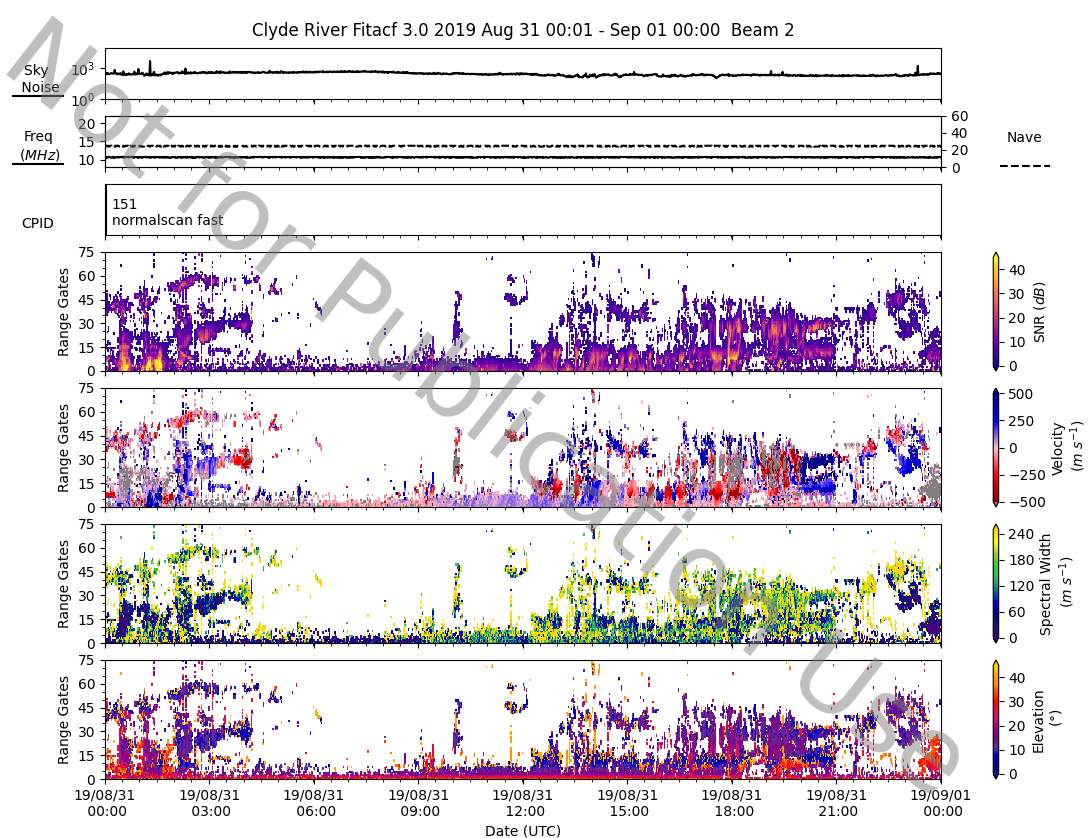
You can change the boundaries on all of the panels by adding more keys to the dictionary. The keys must be named correctly to work, using the strings at the top of this tutorial.
Other common options include:
| Parameter | Action |
|---|---|
| channel=(int) | Specify channel number (default=all) |
| watermark=(bool) | True adds a 'not for publication' watermark |
| cmaps=(dict/str) | Specifies the colour maps used in plotting |
| range_estimation=(RangeEstimation) | Range use for the y-axis (See Ranges, Coords and Projs) |
All options available in time-series and range-time plots can be used in summary plots.