IQ Data and Plotting
Reading IQ Data
import pydarn
iq_file = 'path/to/file/iqdata.iqdat'
iq_data, _ = pydarn.read_iqdat(iq_file)
Note
These methods only work for iqdat formatted files. You can use pyDARNio to read antennas IQ data, or bfiq data. bfiq data can be converted to iqdat for plotting.
IQ Plotting Options
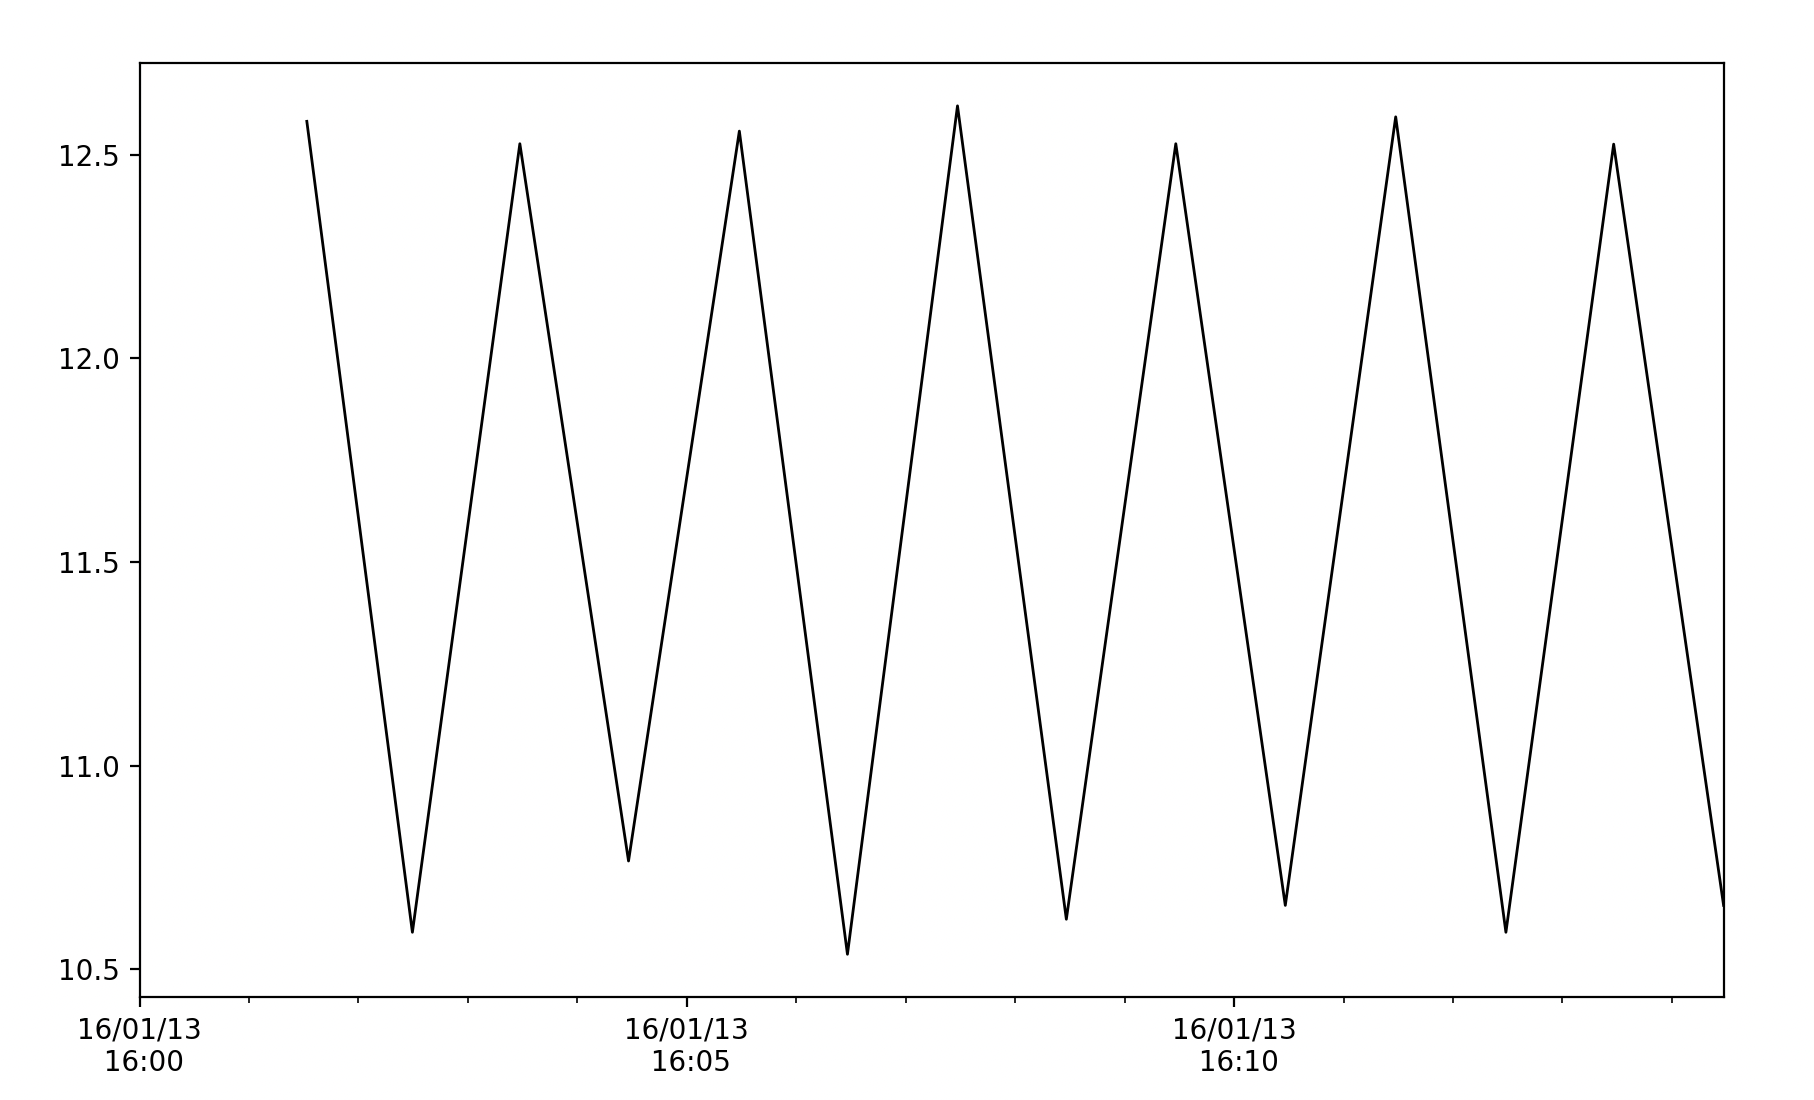
IQ Time Series Plots
These plots show any of the scalar products found in the IQ file. This method directly calls the time series method in the RTP module.
pydarn.IQ.plot_time_series(iq_data, beam_num=7, parameter='tfreq')
plt.show()
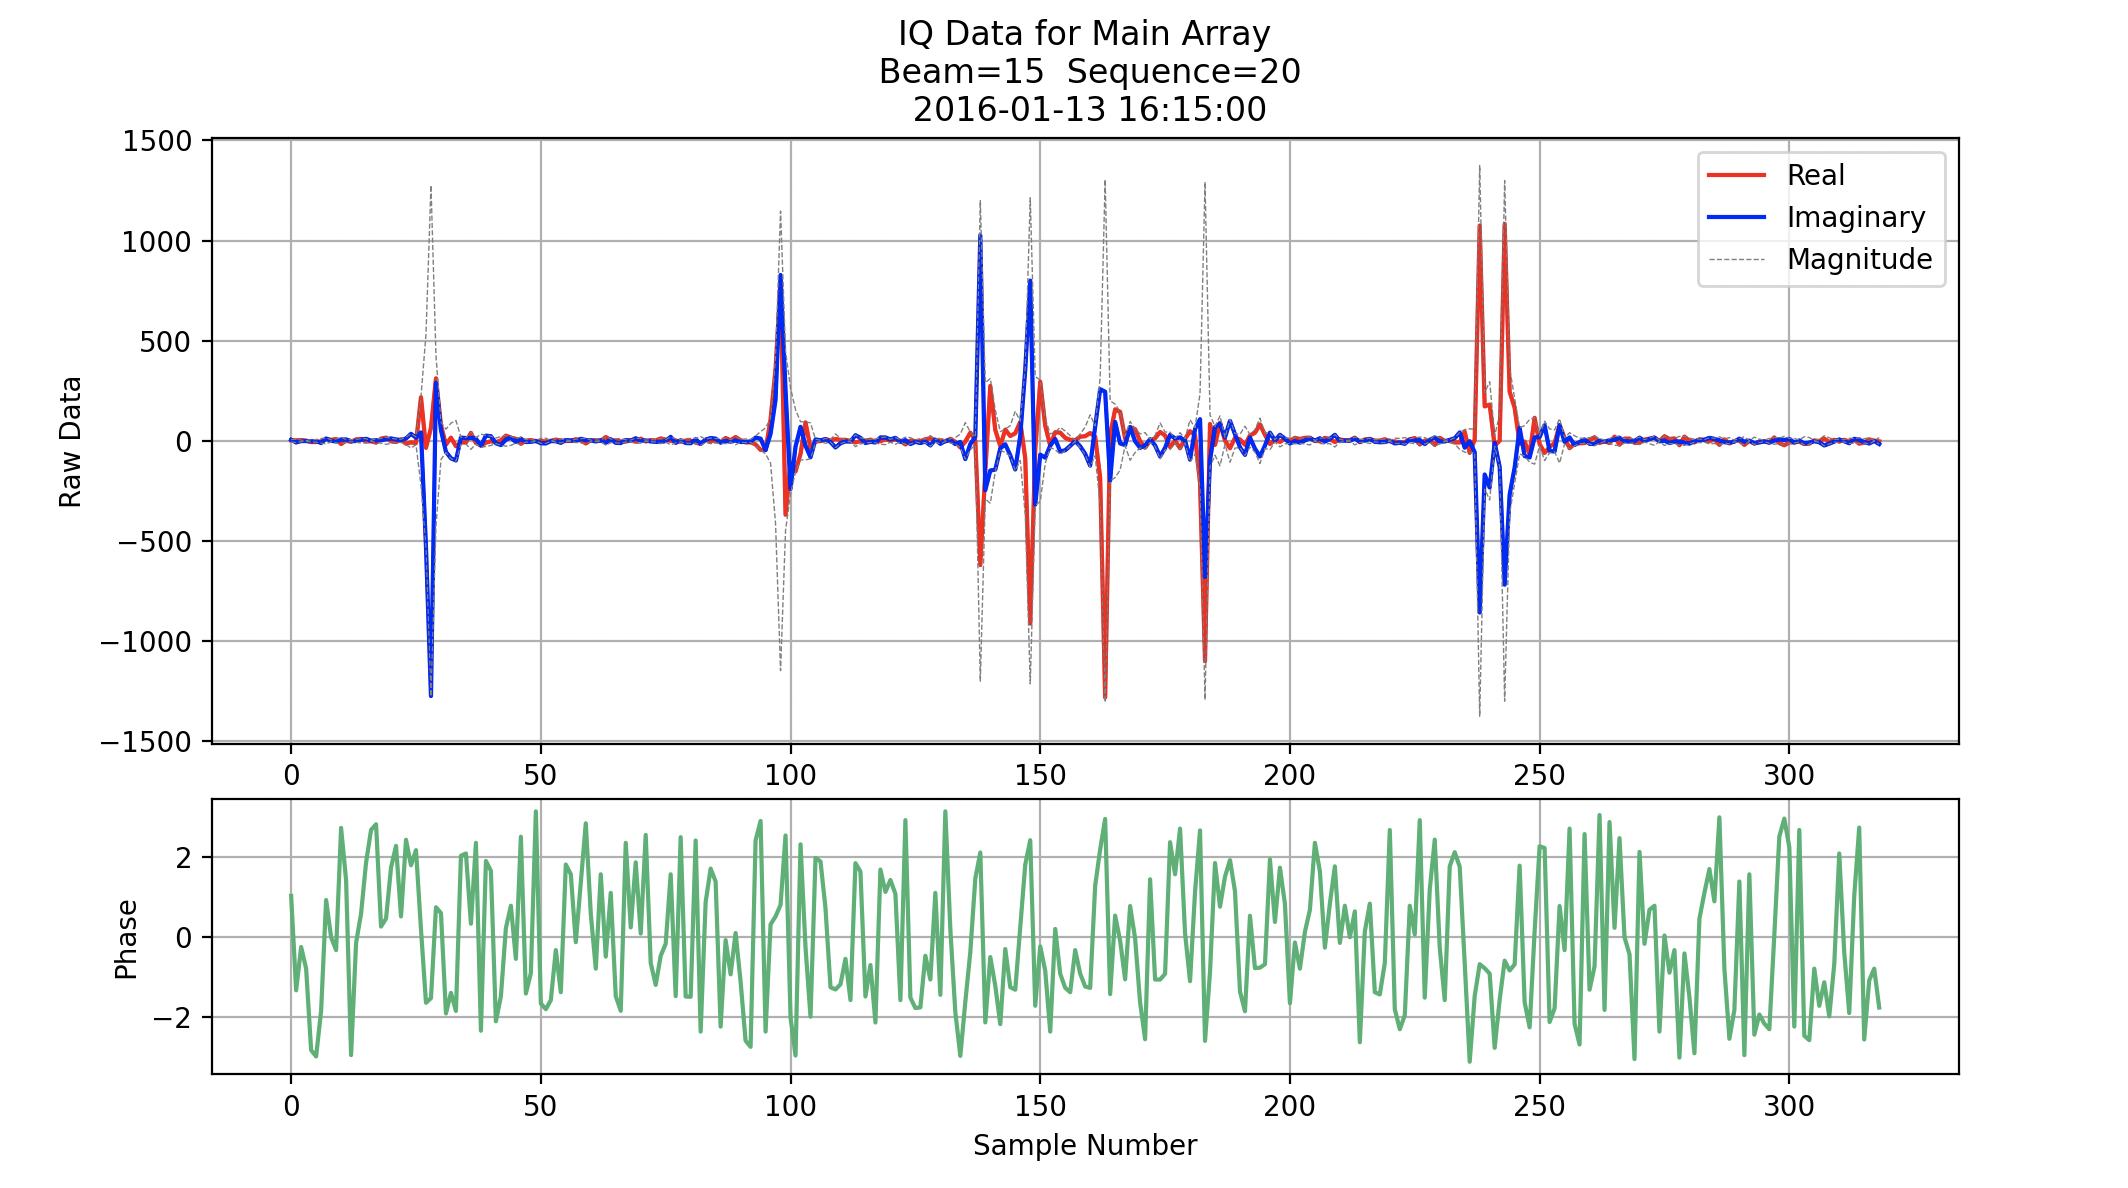
IQ Sequence Plots
The IQ sequence plots will plot the real and imaginary parts of a single sequence of data. There are additional options to view the phase.
You can also choose to view the IQ data from the main array, or the interferometer array using the key work interferometer.
pydarn.IQ.plot_iq_sequence(iq_data, start_time=datetime(2016,1,13,16,15),
                           beam_num=15, sequence_num=20,
                           interferometer=False, plot_phase=True)
plt.show()
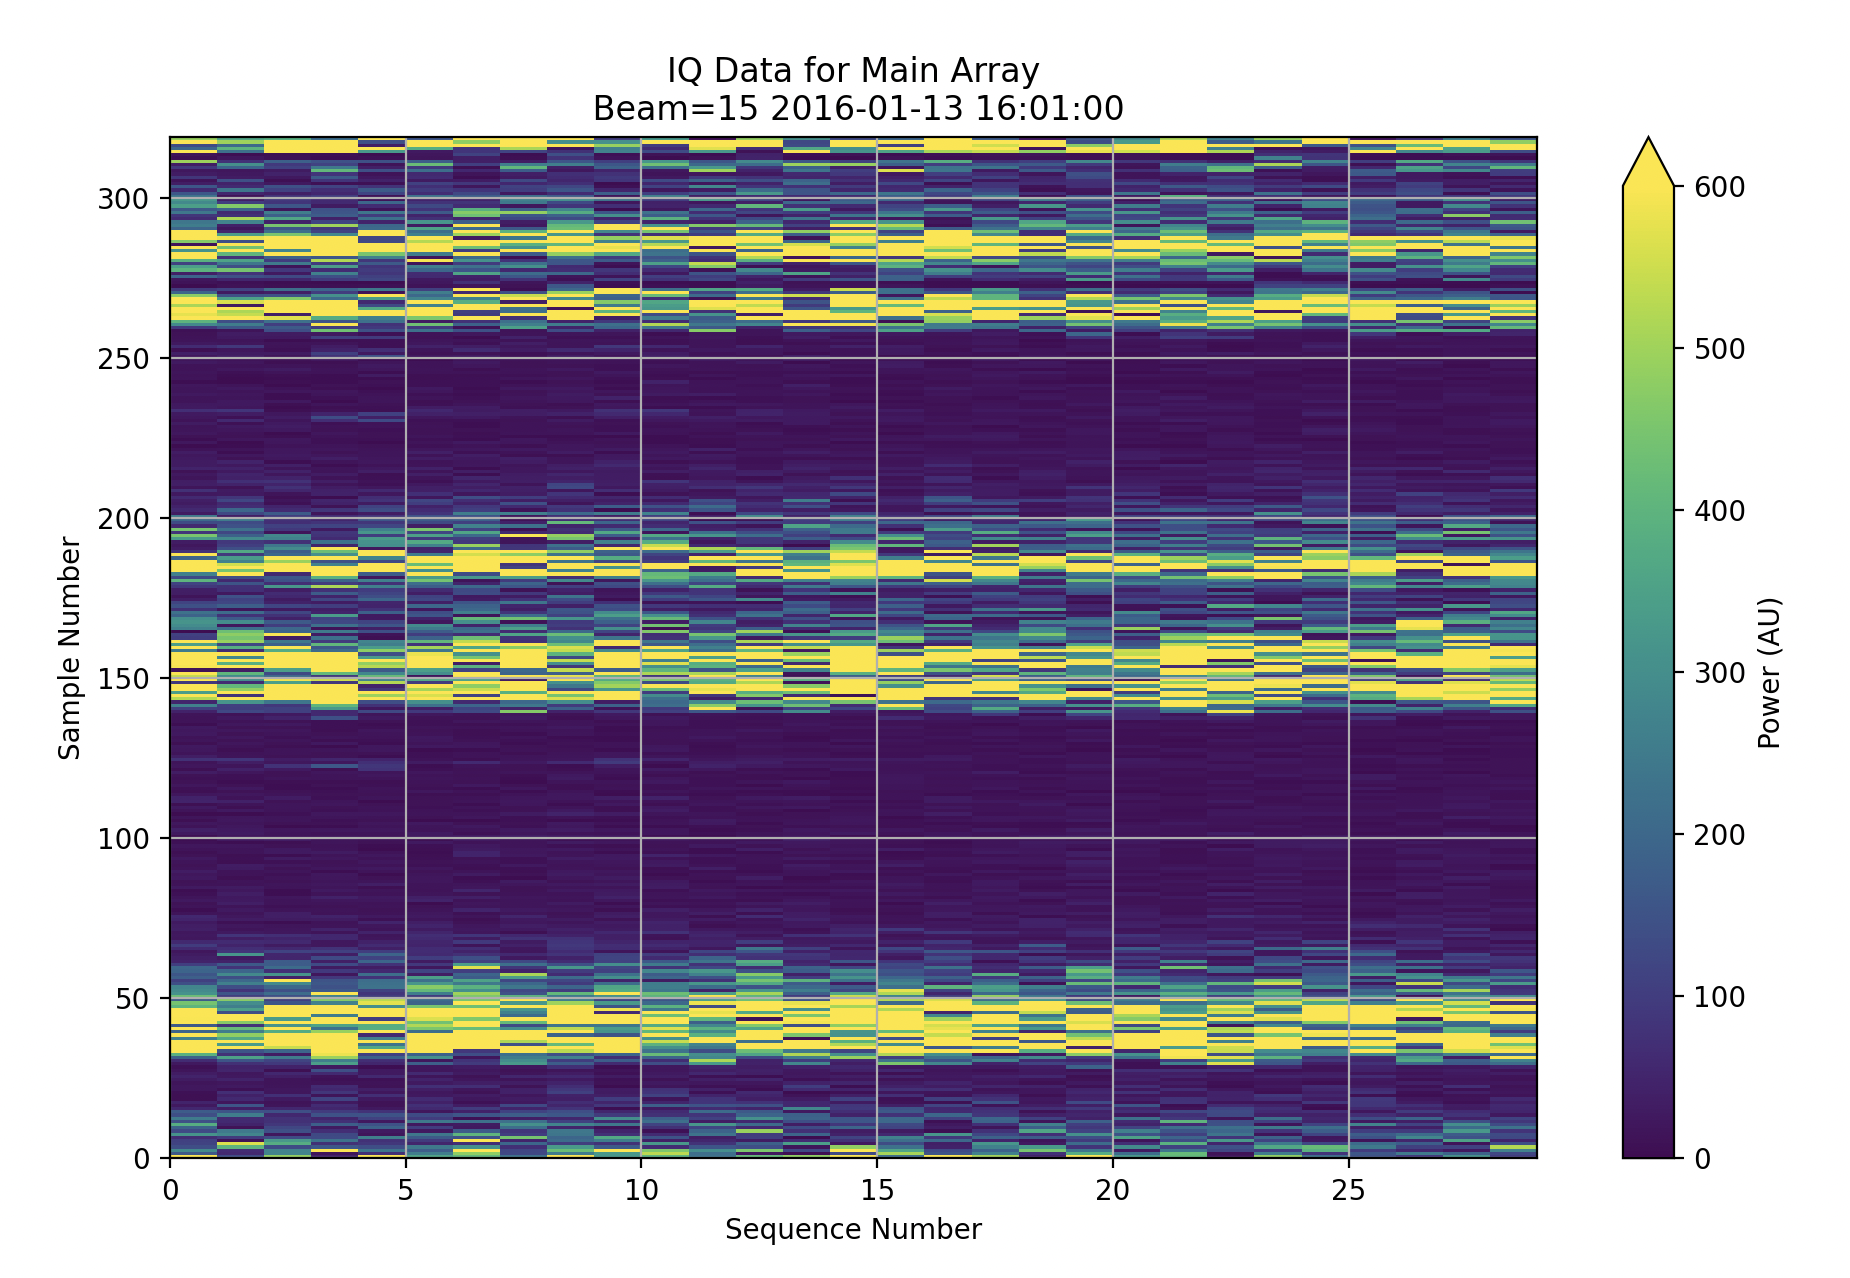
IQ Record Plots
Record plots will plot a single record in a file, given a beam.
You can also choose to view the IQ data from the main array, or the interferometer array using the key work interferometer.
pydarn.IQ.plot_iq_record(iq_data, start_time=datetime(2016,1,13,16,0),
                           beam_num=15, interferometer=False)
plt.show()
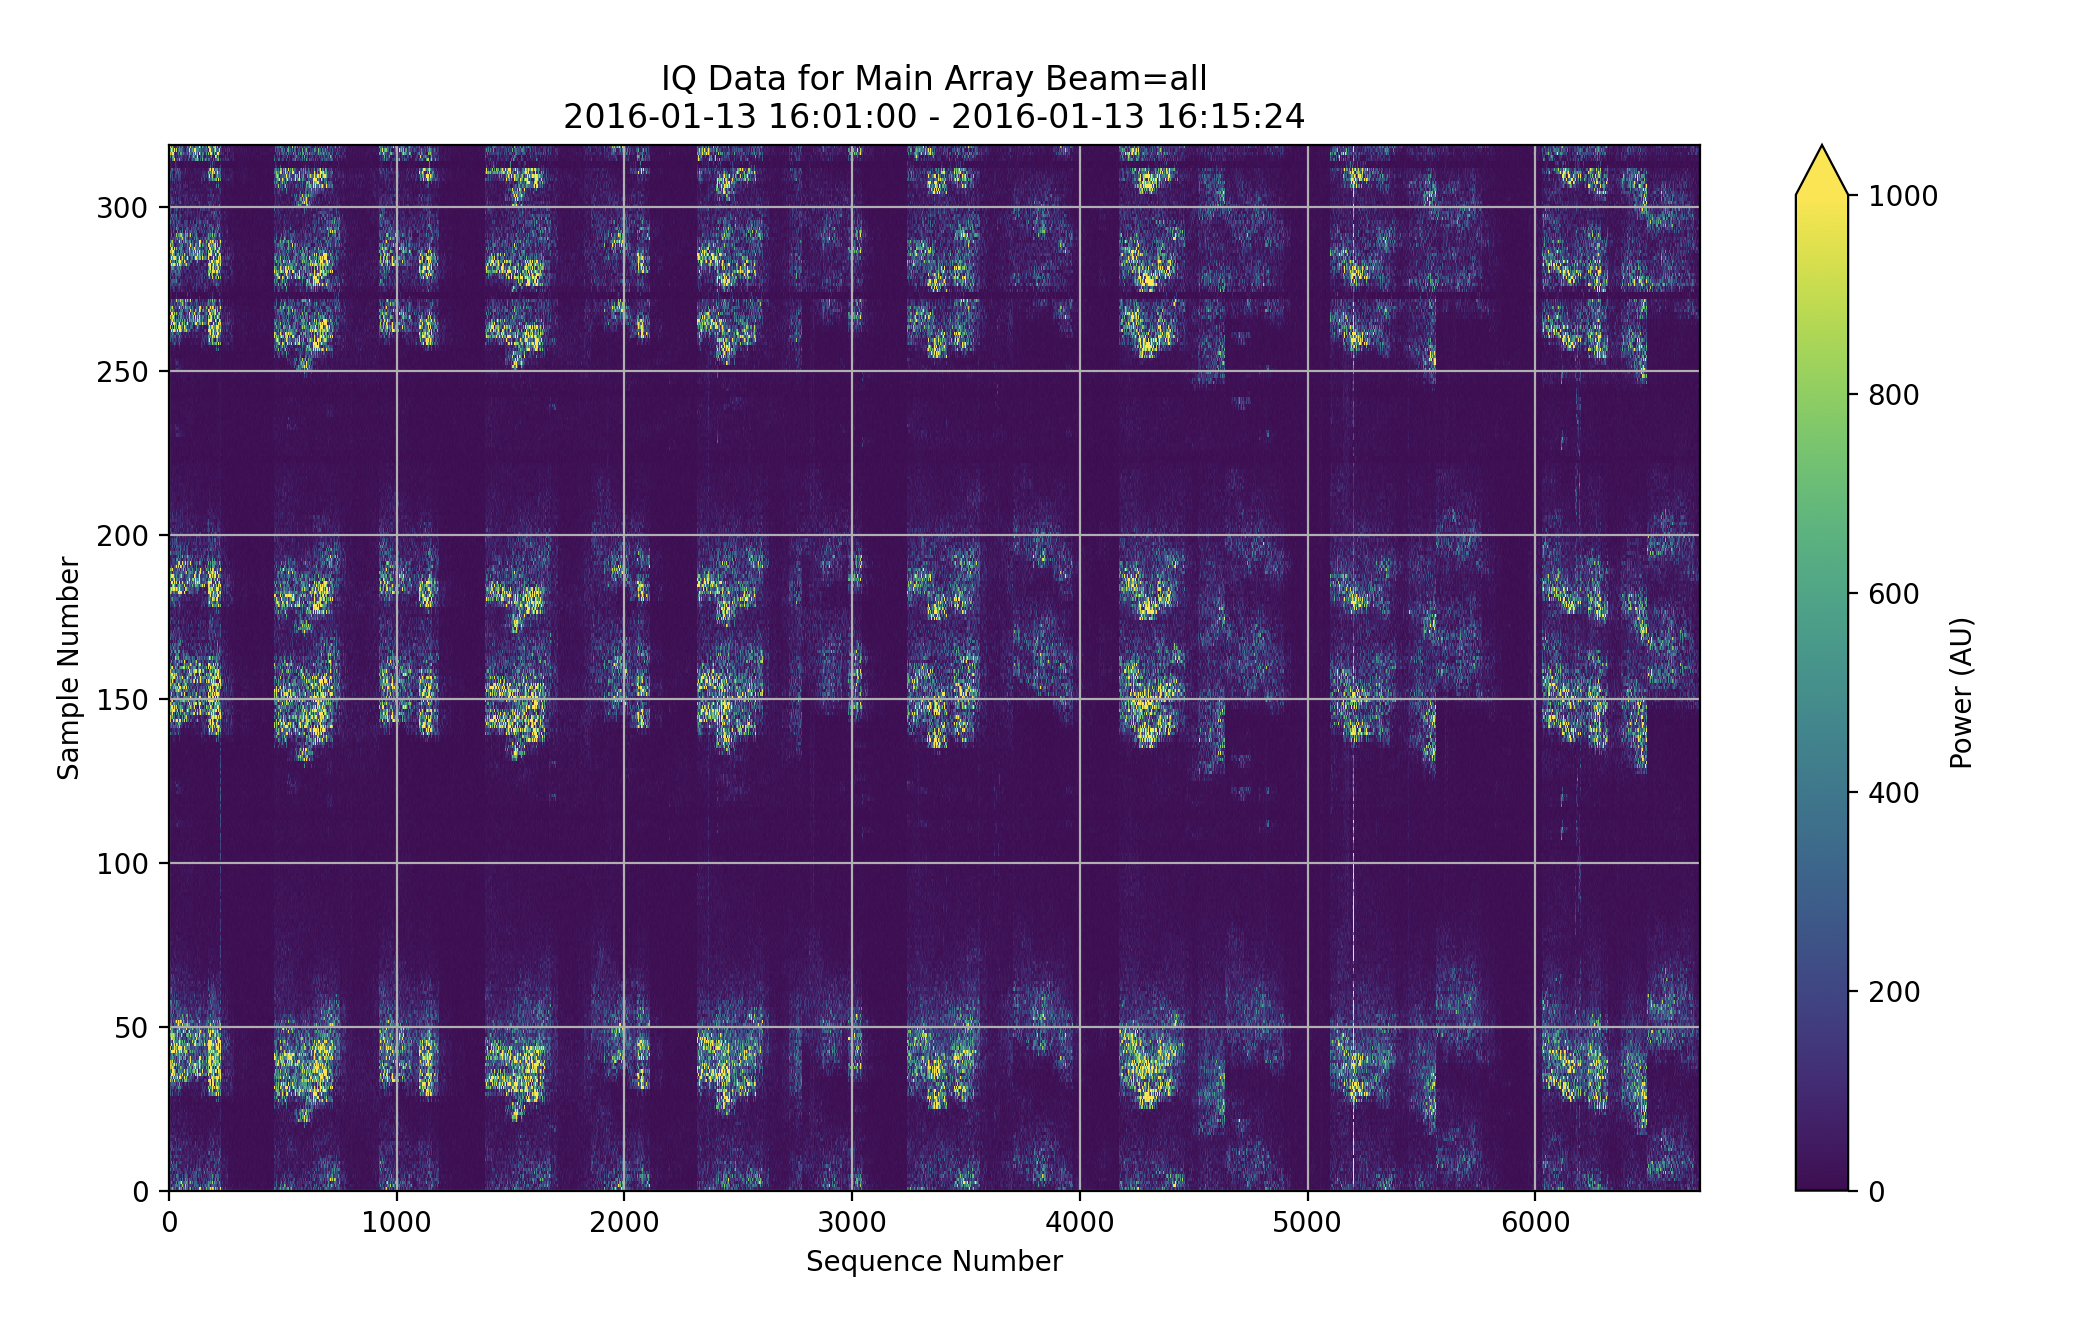
IQ Overview Plots
Overview plots will plot every sequence found in a file for a given beam. All beams is also an option.
You can also choose to view the IQ data from the main array, or the interferometer array using the key work interferometer.
pydarn.IQ.plot_iq_overview(iq_data, beam_num='all', interferometer=False)
plt.show()